29
/es/
es
AIzaSyAYiBZKx7MnpbEhh9jyipgxe19OcubqV5w
April 1, 2024
27919
East Asia & Pacific (excluding high income)
EAP
false
2
1
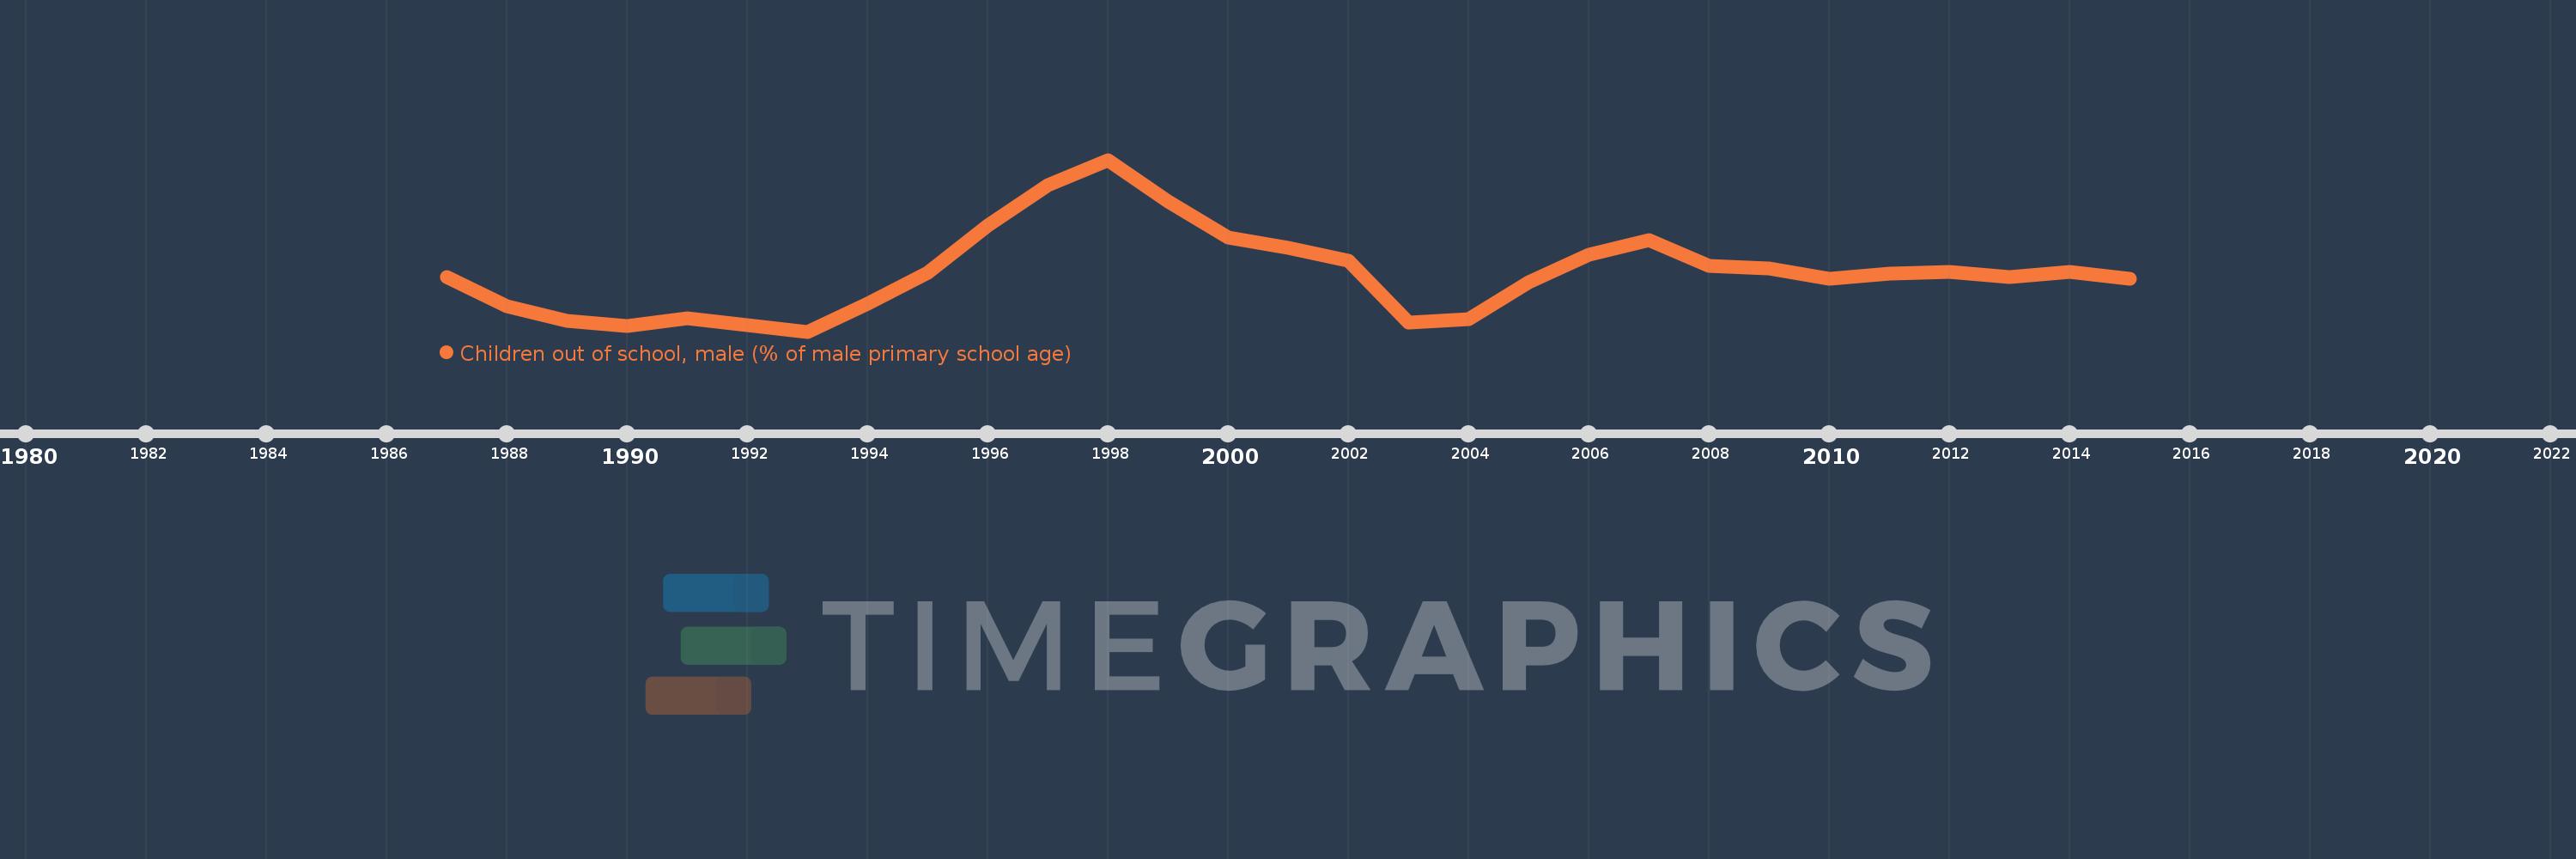
Children out of school, male (% of male primary school age)
2015,2014,2013,2012,2011,2010,2009,2008,2007,2006,2005,2004,2003,2002,2001,2000,1999,1998,1997,1996,1995,1994,1993,1992,1991,1990,1989,1988,1987
Estas estadísticas en otros países:
AfghanistanAlbaniaAlgeriaAngolaAntigua and BarbudaArab WorldArgentinaArmeniaArubaAustraliaAustriaAzerbaijanBahamas, TheBahrainBangladeshBarbadosBelarusBelgiumBelizeBeninBermudaBhutanBoliviaBosnia and HerzegovinaBotswanaBrazilBrunei DarussalamBulgariaBurkina FasoBurundiCabo VerdeCambodiaCameroonCanadaCaribbean small statesCentral African RepublicCentral Europe and the BalticsChadChileChinaColombiaComorosCongo, Dem. Rep.Congo, Rep.Costa RicaCote d'IvoireCroatiaCubaCyprusDenmarkDjiboutiDominicaDominican RepublicEarly-demographic dividendEast Asia & PacificEast Asia & Pacific (excluding high income)East Asia & Pacific (IDA & IBRD countries)EcuadorEgypt, Arab Rep.El SalvadorEquatorial GuineaEritreaEstoniaEthiopiaEuro areaEurope & Central AsiaEurope & Central Asia (excluding high income)Europe & Central Asia (IDA & IBRD countries)European UnionFijiFinlandFragile and conflict affected situationsFranceGabonGambia, TheGeorgiaGhanaGreeceGrenadaGuatemalaGuineaGuinea-BissauGuyanaHaitiHeavily indebted poor countries (HIPC)High incomeHondurasHong Kong SAR, ChinaHungaryIBRD onlyIcelandIDA & IBRD totalIDA blendIDA onlyIDA totalIndiaIndonesiaIran, Islamic Rep.IraqIrelandIsraelItalyJamaicaJapanJordanKazakhstanKenyaKiribatiKorea, Dem. People’s Rep.Korea, Rep.KuwaitKyrgyz RepublicLao PDRLate-demographic dividendLatin America & Caribbean Latin America & Caribbean (excluding high income)Latin America & the Caribbean (IDA & IBRD countries)LatviaLeast developed countries: UN classificationLebanonLesothoLiberiaLibyaLiechtensteinLithuaniaLow & middle incomeLow incomeLower middle incomeLuxembourgMacao SAR, ChinaMacedonia, FYRMadagascarMalawiMaldivesMaliMaltaMarshall IslandsMauritaniaMauritiusMexicoMicronesia, Fed. Sts.Middle East & North AfricaMiddle East & North Africa (excluding high income)Middle East & North Africa (IDA & IBRD countries)Middle incomeMoldovaMongoliaMontenegroMoroccoMozambiqueMyanmarNamibiaNauruNepalNetherlandsNew ZealandNicaraguaNigerNigeriaNorth AmericaNorwayOECD membersOmanOther small statesPacific island small statesPakistanPanamaPapua New GuineaParaguayPeruPhilippinesPolandPortugalPost-demographic dividendPre-demographic dividendPuerto RicoQatarRomaniaRussian FederationRwandaSamoaSan MarinoSao Tome and PrincipeSaudi ArabiaSenegalSerbiaSeychellesSierra LeoneSloveniaSmall statesSolomon IslandsSomaliaSouth AfricaSouth AsiaSouth Asia (IDA & IBRD)South SudanSpainSri LankaSt. Kitts and NevisSt. LuciaSt. Vincent and the GrenadinesSub-Saharan Africa Sub-Saharan Africa (excluding high income)Sub-Saharan Africa (IDA & IBRD countries)SudanSurinameSwazilandSwedenSwitzerlandSyrian Arab RepublicTajikistanTanzaniaThailandTimor-LesteTogoTongaTrinidad and TobagoTunisiaTurkeyTuvaluUgandaUkraineUnited Arab EmiratesUnited KingdomUnited StatesUpper middle incomeUruguayUzbekistanVanuatuVenezuela, RBWest Bank and GazaWorldYemen, Rep.ZambiaZimbabwe línea de tiempo (timeline):
En esta escala de tiempo se presenta un gráfico de 1987 y 2015 de East Asia & Pacific (excluding high income). Los datos de 1986 están ausentes. El número de observaciones reales por fecha: 29.
Fuente (nombre):
Indicadores del desarrollo mundial
Fuente (organización):
United Nations Educational, Scientific, and Cultural Organization (UNESCO) Institute for Statistics.
Categorías:
Education
Se ha actualizado:
23 abr 2017 año
Los indicadores de los cambios de valor en los últimos años
Mínimo:
2.082
1 ene 1993 año
Máximo:
8.211
1 ene 1998 año
A la fecha de observación
Valor
Cambio absoluto
El cambio con respecto al valor anterior
1 ene 1987 año
4.022
+4.022
0.0%
1 ene 1988 año
2.979
-1.043
-25.93%
1 ene 1989 año
2.473
-0.506
-16.98%
1 ene 1990 año
2.276
-0.197
-7.96%
1 ene 1991 año
2.542
+0.266
11.68%
1 ene 1992 año
2.299
-0.243
-9.55%
1 ene 1993 año
2.082
-0.217
-9.46%
1 ene 1994 año
3.064
+0.982
47.18%
1 ene 1995 año
4.191
+1.127
36.79%
1 ene 1996 año
5.861
+1.67
39.84%
1 ene 1997 año
7.302
+1.441
24.59%
1 ene 1998 año
8.211
+0.909
12.45%
1 ene 1999 año
6.729
-1.482
-18.05%
1 ene 2000 año
5.424
-1.305
-19.39%
1 ene 2001 año
5.063
-0.361
-6.66%
1 ene 2002 año
4.611
-0.452
-8.94%
1 ene 2003 año
2.418
-2.193
-47.56%
1 ene 2004 año
2.537
+0.119
4.93%
1 ene 2005 año
3.858
+1.321
52.07%
1 ene 2006 año
4.81
+0.951
24.66%
1 ene 2007 año
5.332
+0.523
10.87%
1 ene 2008 año
4.418
-0.914
-17.15%
1 ene 2009 año
4.343
-0.075
-1.71%
1 ene 2010 año
3.974
-0.368
-8.48%
1 ene 2011 año
4.148
+0.174
4.37%
1 ene 2012 año
4.227
+0.079
1.9%
1 ene 2013 año
4.025
-0.202
-4.78%
1 ene 2014 año
4.226
+0.201
4.99%
1 ene 2015 año
3.959
-0.267
-6.31%
Ranking de los países por los datos estadísticos actuales


Comentarios: