29
/es/
es
AIzaSyAYiBZKx7MnpbEhh9jyipgxe19OcubqV5w
April 1, 2024
33387
European Union
EUU
false
2
1
Exports of goods and services (BoP, current US$)
2016,2015,2014,2013,2012,2011,2010,2009,2008,2007,2006,2005,2004,2003,2002,2001,2000,1999,1998,1997,1996,1995,1994,1993,1992,1991,1990,1989,1988,1987,1986,1985,1984,1983,1982,1981,1980,1979,1978,1977,1976
Estas estadísticas en otros países:
AfghanistanAlbaniaAlgeriaAngolaAntigua and BarbudaArab WorldArgentinaArmeniaArubaAustraliaAustriaAzerbaijanBahamas, TheBahrainBangladeshBarbadosBelarusBelgiumBelizeBeninBermudaBhutanBoliviaBosnia and HerzegovinaBotswanaBrazilBrunei DarussalamBulgariaBurkina FasoBurundiCabo VerdeCambodiaCameroonCanadaCaribbean small statesCentral African RepublicCentral Europe and the BalticsChadChileChinaColombiaComorosCongo, Dem. Rep.Congo, Rep.Costa RicaCote d'IvoireCroatiaCuracaoCyprusCzech RepublicDenmarkDjiboutiDominicaDominican RepublicEarly-demographic dividendEast Asia & PacificEast Asia & Pacific (excluding high income)East Asia & Pacific (IDA & IBRD countries)EcuadorEgypt, Arab Rep.El SalvadorEquatorial GuineaEritreaEstoniaEthiopiaEuro areaEurope & Central AsiaEurope & Central Asia (excluding high income)Europe & Central Asia (IDA & IBRD countries)European UnionFaroe IslandsFijiFinlandFragile and conflict affected situationsFranceFrench PolynesiaGabonGambia, TheGeorgiaGermanyGhanaGreeceGrenadaGuatemalaGuineaGuinea-BissauGuyanaHaitiHeavily indebted poor countries (HIPC)High incomeHondurasHong Kong SAR, ChinaHungaryIBRD onlyIcelandIDA & IBRD totalIDA blendIDA onlyIDA totalIndiaIndonesiaIran, Islamic Rep.IraqIrelandIsraelItalyJamaicaJapanJordanKazakhstanKenyaKiribatiKorea, Rep.KosovoKuwaitKyrgyz RepublicLao PDRLate-demographic dividendLatin America & Caribbean Latin America & Caribbean (excluding high income)Latin America & the Caribbean (IDA & IBRD countries)LatviaLeast developed countries: UN classificationLebanonLesothoLiberiaLibyaLithuaniaLow & middle incomeLow incomeLower middle incomeLuxembourgMacao SAR, ChinaMacedonia, FYRMadagascarMalawiMalaysiaMaldivesMaliMaltaMarshall IslandsMauritaniaMauritiusMexicoMicronesia, Fed. Sts.Middle East & North Africa (excluding high income)Middle East & North Africa (IDA & IBRD countries)Middle incomeMoldovaMongoliaMontenegroMoroccoMozambiqueMyanmarNamibiaNepalNetherlandsNew CaledoniaNicaraguaNigerNigeriaNorth AmericaNorwayOECD membersOmanPacific island small statesPakistanPalauPanamaPapua New GuineaParaguayPeruPhilippinesPolandPortugalPost-demographic dividendPre-demographic dividendQatarRomaniaRussian FederationRwandaSamoaSao Tome and PrincipeSaudi ArabiaSenegalSerbiaSeychellesSierra LeoneSingaporeSint Maarten (Dutch part)Slovak RepublicSloveniaSolomon IslandsSouth AfricaSouth AsiaSouth Asia (IDA & IBRD)South SudanSpainSri LankaSt. Kitts and NevisSt. LuciaSt. Vincent and the GrenadinesSub-Saharan Africa Sub-Saharan Africa (excluding high income)Sub-Saharan Africa (IDA & IBRD countries)SudanSurinameSwazilandSwedenSwitzerlandSyrian Arab RepublicTajikistanTanzaniaThailandTimor-LesteTogoTongaTrinidad and TobagoTunisiaTurkeyTuvaluUgandaUkraineUnited KingdomUnited StatesUpper middle incomeUruguayVanuatuVenezuela, RBVietnamWest Bank and GazaWorldYemen, Rep.ZambiaZimbabwe línea de tiempo (timeline):
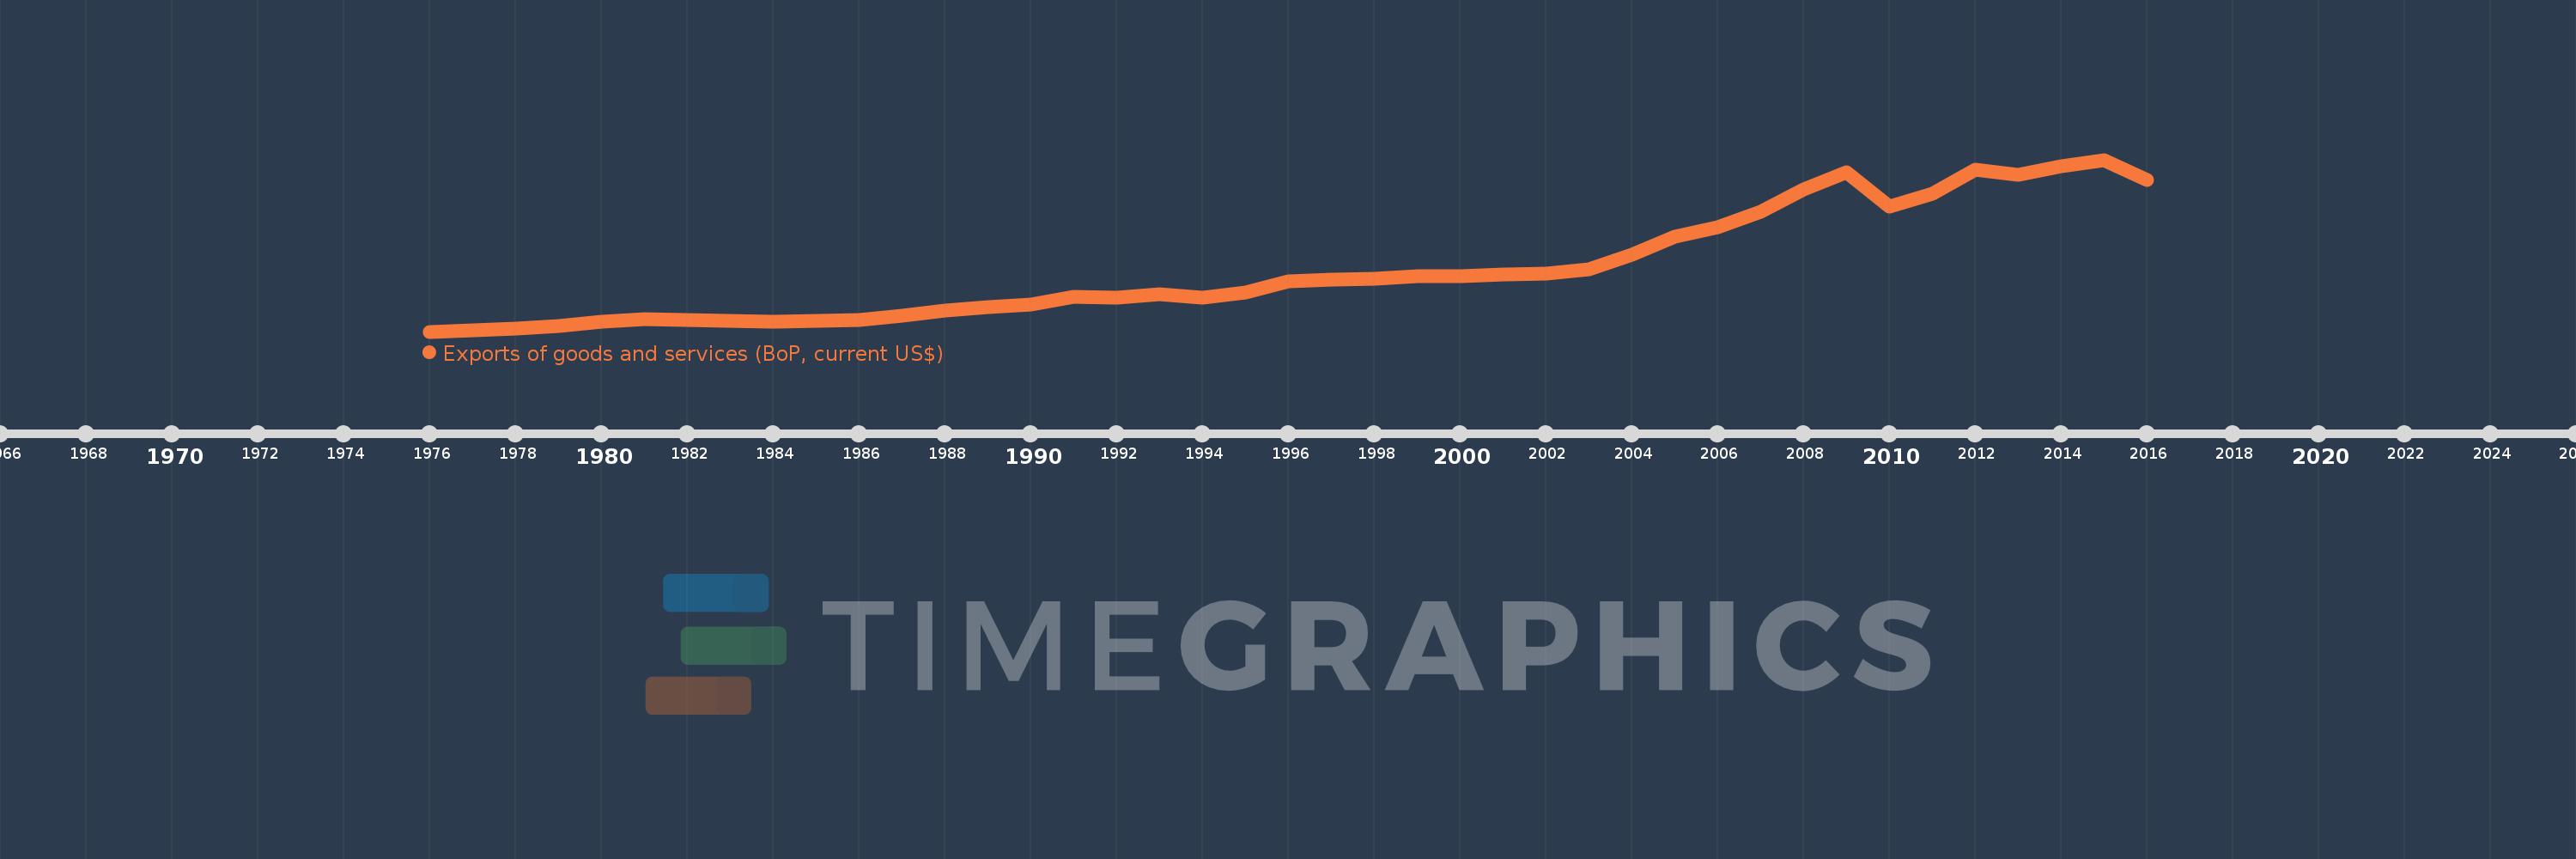
En esta escala de tiempo se presenta un gráfico de 1976 y 2016 de European Union. Los datos de 1975 están ausentes. El número de observaciones reales por fecha: 41.
Fuente (nombre):
Indicadores del desarrollo mundial
Fuente (organización):
International Monetary Fund, Balance of Payments Statistics Yearbook and data files.
Categorías:
Economy & Growth, Trade
Se ha actualizado:
23 abr 2017 año
Los indicadores de los cambios de valor en los últimos años
En promedio:
3.219 billones
Mínimo:
473.626 bn
1 ene 1976 año
Máximo:
8.016 billones
1 ene 2015 año
A la fecha de observación
Valor
Cambio absoluto
El cambio con respecto al valor anterior
1 ene 1976 año
473.626 bn
+473.626 bn
0.0%
1 ene 1977 año
519.561 bn
+45.935 bn
9.7%
1 ene 1978 año
600.608 bn
+81.047 bn
15.6%
1 ene 1979 año
726.075 bn
+125.467 bn
20.89%
1 ene 1980 año
903.967 bn
+177.892 bn
24.5%
1 ene 1981 año
1.035 billones
+131.332 bn
14.53%
1 ene 1982 año
973.939 bn
-61.359 bn
-5.93%
1 ene 1983 año
934.738 bn
-39.201 bn
-4.03%
1 ene 1984 año
906.499 bn
-28.239 bn
-3.02%
1 ene 1985 año
926.347 bn
+19.848 bn
2.19%
1 ene 1986 año
970.919 bn
+44.572 bn
4.81%
1 ene 1987 año
1.175 billones
+203.653 bn
20.98%
1 ene 1988 año
1.408 billones
+233.215 bn
19.86%
1 ene 1989 año
1.554 billones
+146.659 bn
10.42%
1 ene 1990 año
1.643 billones
+88.398 bn
5.69%
1 ene 1991 año
1.982 billones
+339.543 bn
20.67%
1 ene 1992 año
1.969 billones
-13.152 bn
-0.66%
1 ene 1993 año
2.123 billones
+153.753 bn
7.81%
1 ene 1994 año
1.952 billones
-171.267 bn
-8.07%
1 ene 1995 año
2.182 billones
+229.953 bn
11.78%
1 ene 1996 año
2.671 billones
+489.219 bn
22.42%
1 ene 1997 año
2.77 billones
+99.326 bn
3.72%
1 ene 1998 año
2.78 billones
+10.079 bn
0.36%
1 ene 1999 año
2.895 billones
+114.664 bn
4.12%
1 ene 2000 año
2.921 billones
+25.954 bn
0.9%
1 ene 2001 año
2.993 billones
+71.909 bn
2.46%
1 ene 2002 año
3.034 billones
+41.49 bn
1.39%
1 ene 2003 año
3.225 billones
+190.628 bn
6.28%
1 ene 2004 año
3.842 billones
+616.854 bn
19.13%
1 ene 2005 año
4.651 billones
+808.931 bn
21.06%
1 ene 2006 año
5.048 billones
+397.453 bn
8.55%
1 ene 2007 año
5.719 billones
+670.758 bn
13.29%
1 ene 2008 año
6.728 billones
+1.009 billones
17.64%
1 ene 2009 año
7.48 billones
+752.233 bn
11.18%
1 ene 2010 año
5.954 billones
-1.526 billones
-20.41%
1 ene 2011 año
6.522 billones
+568.362 bn
9.55%
1 ene 2012 año
7.585 billones
+1.063 billones
16.3%
1 ene 2013 año
7.346 billones
-239.003 bn
-3.15%
1 ene 2014 año
7.717 billones
+370.647 bn
5.05%
1 ene 2015 año
8.016 billones
+299.557 bn
3.88%
1 ene 2016 año
7.141 billones
-874.957 bn
-10.91%
Ranking de los países por los datos estadísticos actuales


Comentarios: