29
/es/
es
AIzaSyAYiBZKx7MnpbEhh9jyipgxe19OcubqV5w
April 1, 2024
124726
Egypt, Arab Rep.
EGY
true
2
1
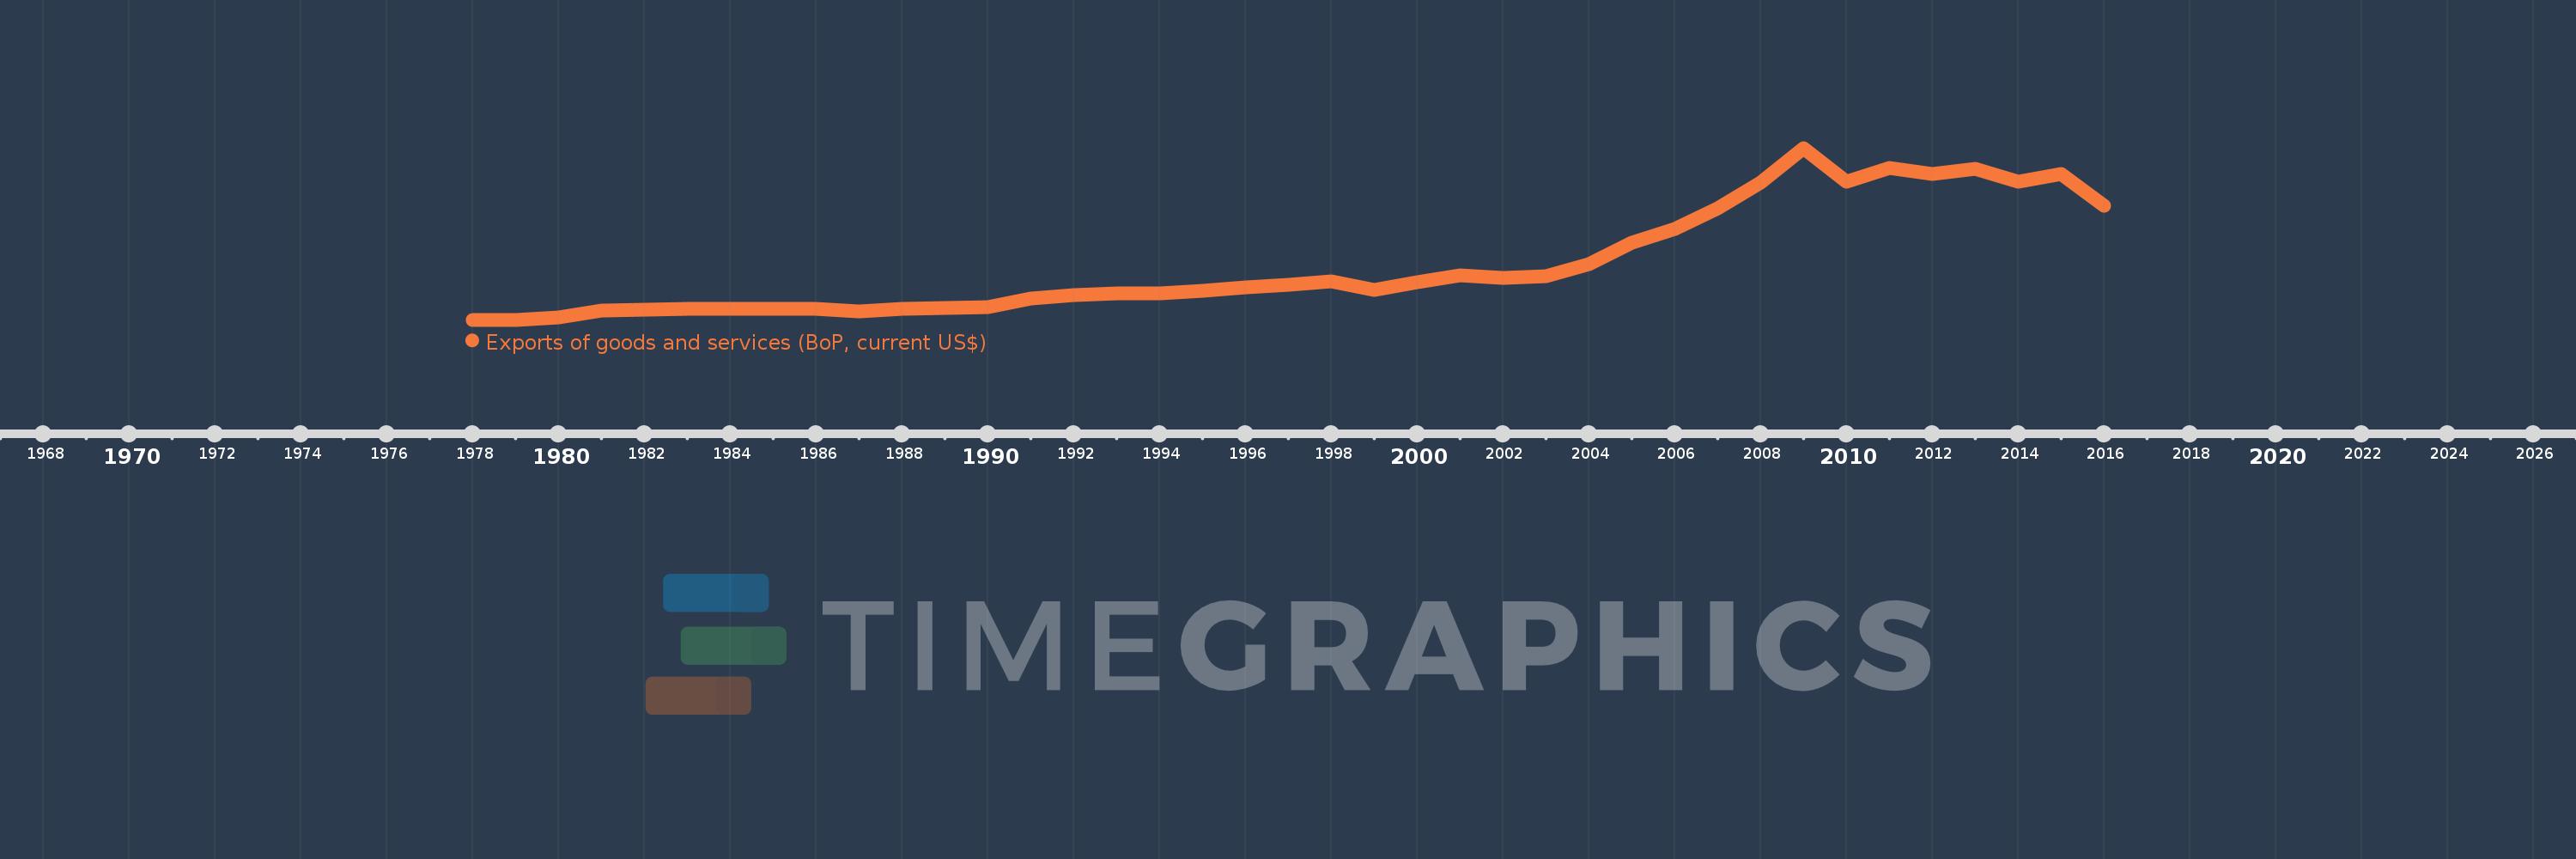
Exports of goods and services (BoP, current US$)
2016,2015,2014,2013,2012,2011,2010,2009,2008,2007,2006,2005,2004,2003,2002,2001,2000,1999,1998,1997,1996,1995,1994,1993,1992,1991,1990,1989,1988,1987,1986,1985,1984,1983,1982,1981,1980,1979,1978
Estas estadísticas en otros países:
AfghanistanAlbaniaAlgeriaAngolaAntigua and BarbudaArab WorldArgentinaArmeniaArubaAustraliaAustriaAzerbaijanBahamas, TheBahrainBangladeshBarbadosBelarusBelgiumBelizeBeninBermudaBhutanBoliviaBosnia and HerzegovinaBotswanaBrazilBrunei DarussalamBulgariaBurkina FasoBurundiCabo VerdeCambodiaCameroonCanadaCaribbean small statesCentral African RepublicCentral Europe and the BalticsChadChileChinaColombiaComorosCongo, Dem. Rep.Congo, Rep.Costa RicaCote d'IvoireCroatiaCuracaoCyprusCzech RepublicDenmarkDjiboutiDominicaDominican RepublicEarly-demographic dividendEast Asia & PacificEast Asia & Pacific (excluding high income)East Asia & Pacific (IDA & IBRD countries)EcuadorEgypt, Arab Rep.El SalvadorEquatorial GuineaEritreaEstoniaEthiopiaEuro areaEurope & Central AsiaEurope & Central Asia (excluding high income)Europe & Central Asia (IDA & IBRD countries)European UnionFaroe IslandsFijiFinlandFragile and conflict affected situationsFranceFrench PolynesiaGabonGambia, TheGeorgiaGermanyGhanaGreeceGrenadaGuatemalaGuineaGuinea-BissauGuyanaHaitiHeavily indebted poor countries (HIPC)High incomeHondurasHong Kong SAR, ChinaHungaryIBRD onlyIcelandIDA & IBRD totalIDA blendIDA onlyIDA totalIndiaIndonesiaIran, Islamic Rep.IraqIrelandIsraelItalyJamaicaJapanJordanKazakhstanKenyaKiribatiKorea, Rep.KosovoKuwaitKyrgyz RepublicLao PDRLate-demographic dividendLatin America & Caribbean Latin America & Caribbean (excluding high income)Latin America & the Caribbean (IDA & IBRD countries)LatviaLeast developed countries: UN classificationLebanonLesothoLiberiaLibyaLithuaniaLow & middle incomeLow incomeLower middle incomeLuxembourgMacao SAR, ChinaMacedonia, FYRMadagascarMalawiMalaysiaMaldivesMaliMaltaMarshall IslandsMauritaniaMauritiusMexicoMicronesia, Fed. Sts.Middle East & North Africa (excluding high income)Middle East & North Africa (IDA & IBRD countries)Middle incomeMoldovaMongoliaMontenegroMoroccoMozambiqueMyanmarNamibiaNepalNetherlandsNew CaledoniaNicaraguaNigerNigeriaNorth AmericaNorwayOECD membersOmanPacific island small statesPakistanPalauPanamaPapua New GuineaParaguayPeruPhilippinesPolandPortugalPost-demographic dividendPre-demographic dividendQatarRomaniaRussian FederationRwandaSamoaSao Tome and PrincipeSaudi ArabiaSenegalSerbiaSeychellesSierra LeoneSingaporeSint Maarten (Dutch part)Slovak RepublicSloveniaSolomon IslandsSouth AfricaSouth AsiaSouth Asia (IDA & IBRD)South SudanSpainSri LankaSt. Kitts and NevisSt. LuciaSt. Vincent and the GrenadinesSub-Saharan Africa Sub-Saharan Africa (excluding high income)Sub-Saharan Africa (IDA & IBRD countries)SudanSurinameSwazilandSwedenSwitzerlandSyrian Arab RepublicTajikistanTanzaniaThailandTimor-LesteTogoTongaTrinidad and TobagoTunisiaTurkeyTuvaluUgandaUkraineUnited KingdomUnited StatesUpper middle incomeUruguayVanuatuVenezuela, RBVietnamWest Bank and GazaWorldYemen, Rep.ZambiaZimbabwe línea de tiempo (timeline):
En esta escala de tiempo se presenta un gráfico de 1978 y 2016 de Egypt, Arab Rep.. Los datos de 1977 están ausentes. El número de observaciones reales por fecha: 39.
Fuente (nombre):
Indicadores del desarrollo mundial
Fuente (organización):
International Monetary Fund, Balance of Payments Statistics Yearbook and data files.
Categorías:
Economy & Growth, Trade
Se ha actualizado:
23 abr 2017 año
Los indicadores de los cambios de valor en los últimos años
Mínimo:
3.572 bn
1 ene 1979 año
Máximo:
54.761 bn
1 ene 2009 año
A la fecha de observación
Valor
Cambio absoluto
El cambio con respecto al valor anterior
1 ene 1978 año
3.575 bn
+3.575 bn
0.0%
1 ene 1979 año
3.572 bn
-2.556 millones
-0.07%
1 ene 1980 año
4.212 bn
+639.708 millones
17.91%
1 ene 1981 año
6.246 bn
+2.034 bn
48.3%
1 ene 1982 año
6.536 bn
+289.429 millones
4.63%
1 ene 1983 año
6.818 bn
+282.429 millones
4.32%
1 ene 1984 año
6.826 bn
+7.857 millones
0.12%
1 ene 1985 año
6.854 bn
+27.857 millones
0.41%
1 ene 1986 año
6.859 bn
+5.286 millones
0.08%
1 ene 1987 año
5.99 bn
-868.857 millones
-12.67%
1 ene 1988 año
6.742 bn
+751.714 millones
12.55%
1 ene 1989 año
7.177 bn
+435.286 millones
6.46%
1 ene 1990 año
7.322 bn
+144.442 millones
2.01%
1 ene 1991 año
9.895 bn
+2.573 bn
35.15%
1 ene 1992 año
10.947 bn
+1.052 bn
10.63%
1 ene 1993 año
11.386 bn
+439.0 millones
4.01%
1 ene 1994 año
11.44 bn
+54.0 millones
0.47%
1 ene 1995 año
12.114 bn
+674.0 millones
5.89%
1 ene 1996 año
13.26 bn
+1.146 bn
9.46%
1 ene 1997 año
14.05 bn
+790.0 millones
5.96%
1 ene 1998 año
14.905 bn
+855.2 millones
6.09%
1 ene 1999 año
12.544 bn
-2.361 bn
-15.84%
1 ene 2000 año
14.73 bn
+2.186 bn
17.43%
1 ene 2001 año
16.864 bn
+2.134 bn
14.49%
1 ene 2002 año
16.067 bn
-796.8 millones
-4.72%
1 ene 2003 año
16.438 bn
+370.7 millones
2.31%
1 ene 2004 año
20.06 bn
+3.622 bn
22.04%
1 ene 2005 año
26.516 bn
+6.456 bn
32.18%
1 ene 2006 año
30.716 bn
+4.2 bn
15.84%
1 ene 2007 año
36.68 bn
+5.964 bn
19.42%
1 ene 2008 año
44.398 bn
+7.718 bn
21.04%
1 ene 2009 año
54.761 bn
+10.363 bn
23.34%
1 ene 2010 año
44.609 bn
-10.152 bn
-18.54%
1 ene 2011 año
48.831 bn
+4.222 bn
9.46%
1 ene 2012 año
47.053 bn
-1.778 bn
-3.64%
1 ene 2013 año
48.601 bn
+1.548 bn
3.29%
1 ene 2014 año
44.795 bn
-3.806 bn
-7.83%
1 ene 2015 año
47.101 bn
+2.306 bn
5.15%
1 ene 2016 año
37.569 bn
-9.532 bn
-20.24%
Ranking de los países por los datos estadísticos actuales


Comentarios: