29
/es/
es
AIzaSyAYiBZKx7MnpbEhh9jyipgxe19OcubqV5w
April 1, 2024
29044
East Asia & Pacific (IDA & IBRD countries)
TEA
false
2
1
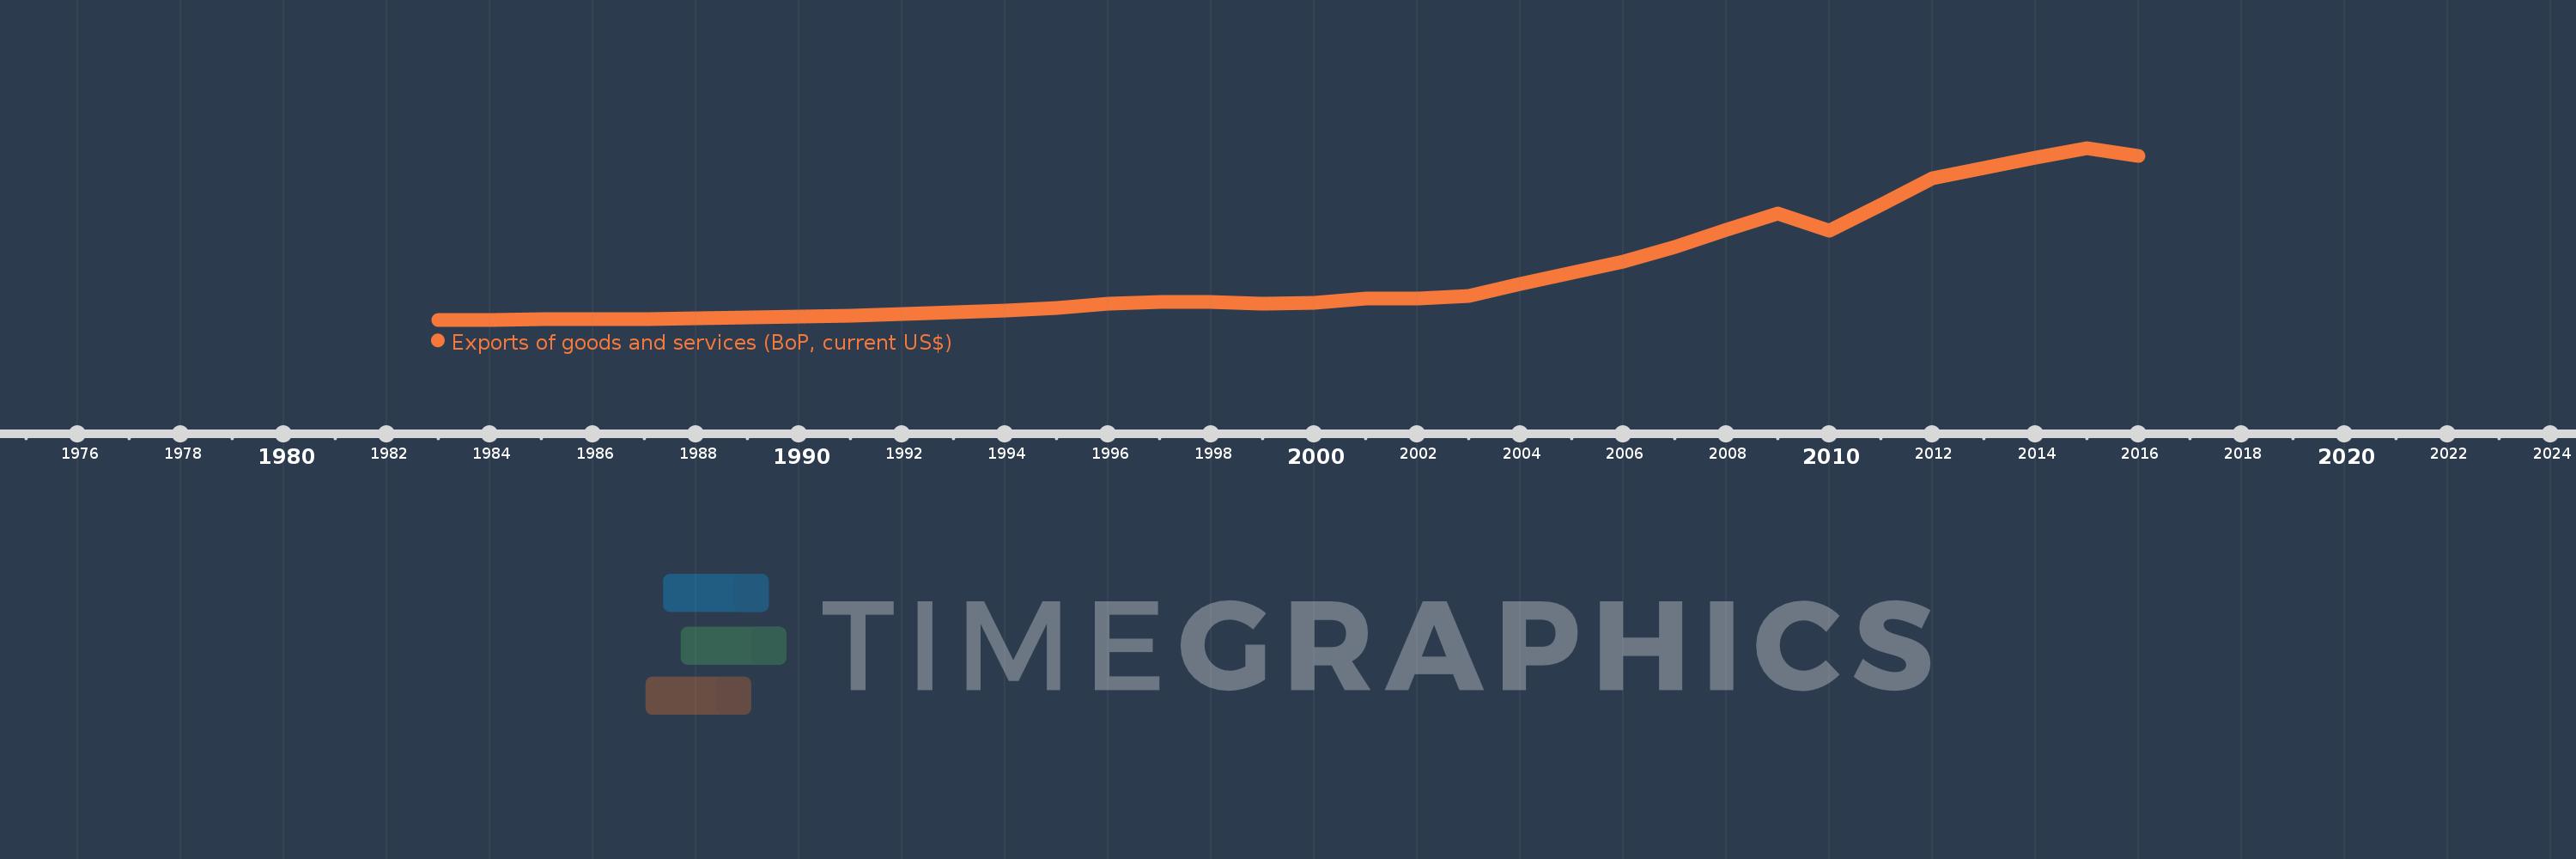
Exports of goods and services (BoP, current US$)
2016,2015,2014,2013,2012,2011,2010,2009,2008,2007,2006,2005,2004,2003,2002,2001,2000,1999,1998,1997,1996,1995,1994,1993,1992,1991,1990,1989,1988,1987,1986,1985,1984,1983
Estas estadísticas en otros países:
AfghanistanAlbaniaAlgeriaAngolaAntigua and BarbudaArab WorldArgentinaArmeniaArubaAustraliaAustriaAzerbaijanBahamas, TheBahrainBangladeshBarbadosBelarusBelgiumBelizeBeninBermudaBhutanBoliviaBosnia and HerzegovinaBotswanaBrazilBrunei DarussalamBulgariaBurkina FasoBurundiCabo VerdeCambodiaCameroonCanadaCaribbean small statesCentral African RepublicCentral Europe and the BalticsChadChileChinaColombiaComorosCongo, Dem. Rep.Congo, Rep.Costa RicaCote d'IvoireCroatiaCuracaoCyprusCzech RepublicDenmarkDjiboutiDominicaDominican RepublicEarly-demographic dividendEast Asia & PacificEast Asia & Pacific (excluding high income)East Asia & Pacific (IDA & IBRD countries)EcuadorEgypt, Arab Rep.El SalvadorEquatorial GuineaEritreaEstoniaEthiopiaEuro areaEurope & Central AsiaEurope & Central Asia (excluding high income)Europe & Central Asia (IDA & IBRD countries)European UnionFaroe IslandsFijiFinlandFragile and conflict affected situationsFranceFrench PolynesiaGabonGambia, TheGeorgiaGermanyGhanaGreeceGrenadaGuatemalaGuineaGuinea-BissauGuyanaHaitiHeavily indebted poor countries (HIPC)High incomeHondurasHong Kong SAR, ChinaHungaryIBRD onlyIcelandIDA & IBRD totalIDA blendIDA onlyIDA totalIndiaIndonesiaIran, Islamic Rep.IraqIrelandIsraelItalyJamaicaJapanJordanKazakhstanKenyaKiribatiKorea, Rep.KosovoKuwaitKyrgyz RepublicLao PDRLate-demographic dividendLatin America & Caribbean Latin America & Caribbean (excluding high income)Latin America & the Caribbean (IDA & IBRD countries)LatviaLeast developed countries: UN classificationLebanonLesothoLiberiaLibyaLithuaniaLow & middle incomeLow incomeLower middle incomeLuxembourgMacao SAR, ChinaMacedonia, FYRMadagascarMalawiMalaysiaMaldivesMaliMaltaMarshall IslandsMauritaniaMauritiusMexicoMicronesia, Fed. Sts.Middle East & North Africa (excluding high income)Middle East & North Africa (IDA & IBRD countries)Middle incomeMoldovaMongoliaMontenegroMoroccoMozambiqueMyanmarNamibiaNepalNetherlandsNew CaledoniaNicaraguaNigerNigeriaNorth AmericaNorwayOECD membersOmanPacific island small statesPakistanPalauPanamaPapua New GuineaParaguayPeruPhilippinesPolandPortugalPost-demographic dividendPre-demographic dividendQatarRomaniaRussian FederationRwandaSamoaSao Tome and PrincipeSaudi ArabiaSenegalSerbiaSeychellesSierra LeoneSingaporeSint Maarten (Dutch part)Slovak RepublicSloveniaSolomon IslandsSouth AfricaSouth AsiaSouth Asia (IDA & IBRD)South SudanSpainSri LankaSt. Kitts and NevisSt. LuciaSt. Vincent and the GrenadinesSub-Saharan Africa Sub-Saharan Africa (excluding high income)Sub-Saharan Africa (IDA & IBRD countries)SudanSurinameSwazilandSwedenSwitzerlandSyrian Arab RepublicTajikistanTanzaniaThailandTimor-LesteTogoTongaTrinidad and TobagoTunisiaTurkeyTuvaluUgandaUkraineUnited KingdomUnited StatesUpper middle incomeUruguayVanuatuVenezuela, RBVietnamWest Bank and GazaWorldYemen, Rep.ZambiaZimbabwe línea de tiempo (timeline):
En esta escala de tiempo se presenta un gráfico de 1983 y 2016 de East Asia & Pacific (IDA & IBRD countries). Los datos de 1982 están ausentes. El número de observaciones reales por fecha: 34.
Fuente (nombre):
Indicadores del desarrollo mundial
Fuente (organización):
International Monetary Fund, Balance of Payments Statistics Yearbook and data files.
Categorías:
Economy & Growth, Trade
Se ha actualizado:
23 abr 2017 año
Los indicadores de los cambios de valor en los últimos años
En promedio:
1.027 billones
Mínimo:
77.357 bn
1 ene 1983 año
Máximo:
3.539 billones
1 ene 2015 año
A la fecha de observación
Valor
Cambio absoluto
El cambio con respecto al valor anterior
1 ene 1983 año
77.357 bn
+77.357 bn
0.0%
1 ene 1984 año
77.489 bn
+132.277 millones
0.17%
1 ene 1985 año
87.692 bn
+10.203 bn
13.17%
1 ene 1986 año
85.411 bn
-2.281 bn
-2.6%
1 ene 1987 año
84.304 bn
-1.107 bn
-1.3%
1 ene 1988 año
106.091 bn
+21.787 bn
25.84%
1 ene 1989 año
126.615 bn
+20.524 bn
19.35%
1 ene 1990 año
143.601 bn
+16.986 bn
13.42%
1 ene 1991 año
167.191 bn
+23.59 bn
16.43%
1 ene 1992 año
192.459 bn
+25.268 bn
15.11%
1 ene 1993 año
226.513 bn
+34.054 bn
17.69%
1 ene 1994 año
255.044 bn
+28.532 bn
12.6%
1 ene 1995 año
320.385 bn
+65.341 bn
25.62%
1 ene 1996 año
396.748 bn
+76.363 bn
23.83%
1 ene 1997 año
442.709 bn
+45.962 bn
11.58%
1 ene 1998 año
429.224 bn
-13.485 bn
-3.05%
1 ene 1999 año
401.673 bn
-27.551 bn
-6.42%
1 ene 2000 año
418.576 bn
+16.902 bn
4.21%
1 ene 2001 año
508.128 bn
+89.553 bn
21.39%
1 ene 2002 año
501.265 bn
-6.864 bn
-1.35%
1 ene 2003 año
558.957 bn
+57.693 bn
11.51%
1 ene 2004 año
791.225 bn
+232.267 bn
41.55%
1 ene 2005 año
1.017 billones
+226.101 bn
28.58%
1 ene 2006 año
1.245 billones
+227.744 bn
22.39%
1 ene 2007 año
1.54 billones
+295.427 bn
23.73%
1 ene 2008 año
1.889 billones
+348.56 bn
22.63%
1 ene 2009 año
2.222 billones
+333.145 bn
17.64%
1 ene 2010 año
1.871 billones
-350.758 bn
-15.78%
1 ene 2011 año
2.383 billones
+511.097 bn
27.31%
1 ene 2012 año
2.936 billones
+553.587 bn
23.24%
1 ene 2013 año
3.141 billones
+204.585 bn
6.97%
1 ene 2014 año
3.342 billones
+201.374 bn
6.41%
1 ene 2015 año
3.539 billones
+196.428 bn
5.88%
1 ene 2016 año
3.379 billones
-159.744 bn
-4.51%
Ranking de los países por los datos estadísticos actuales


Comentarios: