29
/es/
es
AIzaSyAYiBZKx7MnpbEhh9jyipgxe19OcubqV5w
April 1, 2024
32760
Europe & Central Asia (IDA & IBRD countries)
TEC
false
2
1
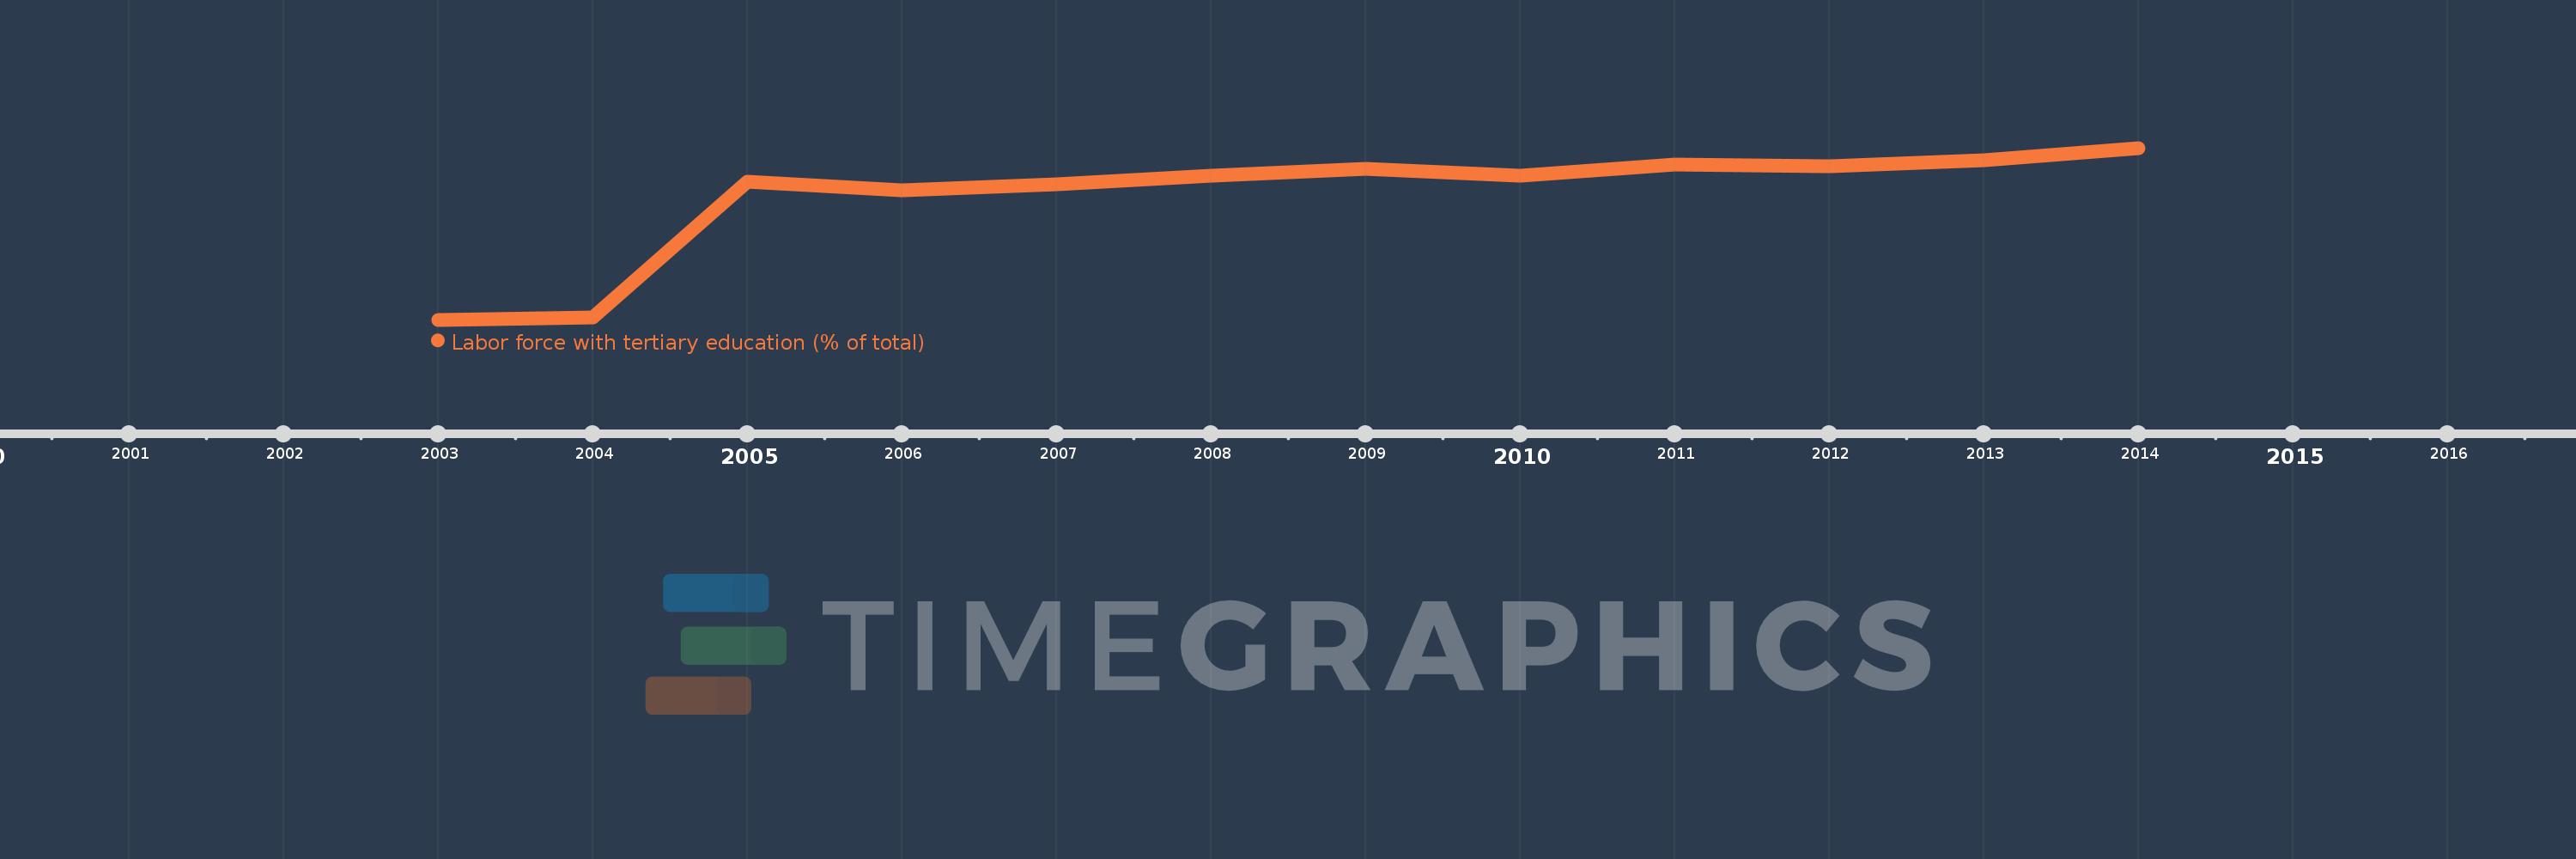
Labor force with tertiary education (% of total)
2014,2013,2012,2011,2010,2009,2008,2007,2006,2005,2004,2003
Estas estadísticas en otros países:
línea de tiempo (timeline):
En esta escala de tiempo se presenta un gráfico de 2003 y 2014 de Europe & Central Asia (IDA & IBRD countries). Los datos de 2002 están ausentes. El número de observaciones reales por fecha: 12.
Fuente (nombre):
Indicadores del desarrollo mundial
Fuente (organización):
International Labour Organization, Key Indicators of the Labour Market database.
Categorías:
Education, Social Protection & Labor
Se ha actualizado:
23 abr 2017 año
Los indicadores de los cambios de valor en los últimos años
Mínimo:
20.984
1 ene 2003 año
Máximo:
39.12
1 ene 2014 año
A la fecha de observación
Valor
Cambio absoluto
El cambio con respecto al valor anterior
1 ene 2003 año
20.984
+20.984
0.0%
1 ene 2004 año
21.21
+0.226
1.08%
1 ene 2005 año
35.567
+14.357
67.69%
1 ene 2006 año
34.637
-0.93
-2.61%
1 ene 2007 año
35.315
+0.678
1.96%
1 ene 2008 año
36.235
+0.92
2.6%
1 ene 2009 año
36.912
+0.678
1.87%
1 ene 2010 año
36.18
-0.732
-1.98%
1 ene 2011 año
37.406
+1.226
3.39%
1 ene 2012 año
37.147
-0.259
-0.69%
1 ene 2013 año
37.868
+0.721
1.94%
1 ene 2014 año
39.12
+1.251
3.3%
Ranking de los países por los datos estadísticos actuales


Comentarios: