29
/es/
es
AIzaSyAYiBZKx7MnpbEhh9jyipgxe19OcubqV5w
April 1, 2024
209490
New Zealand
NZL
true
2
1
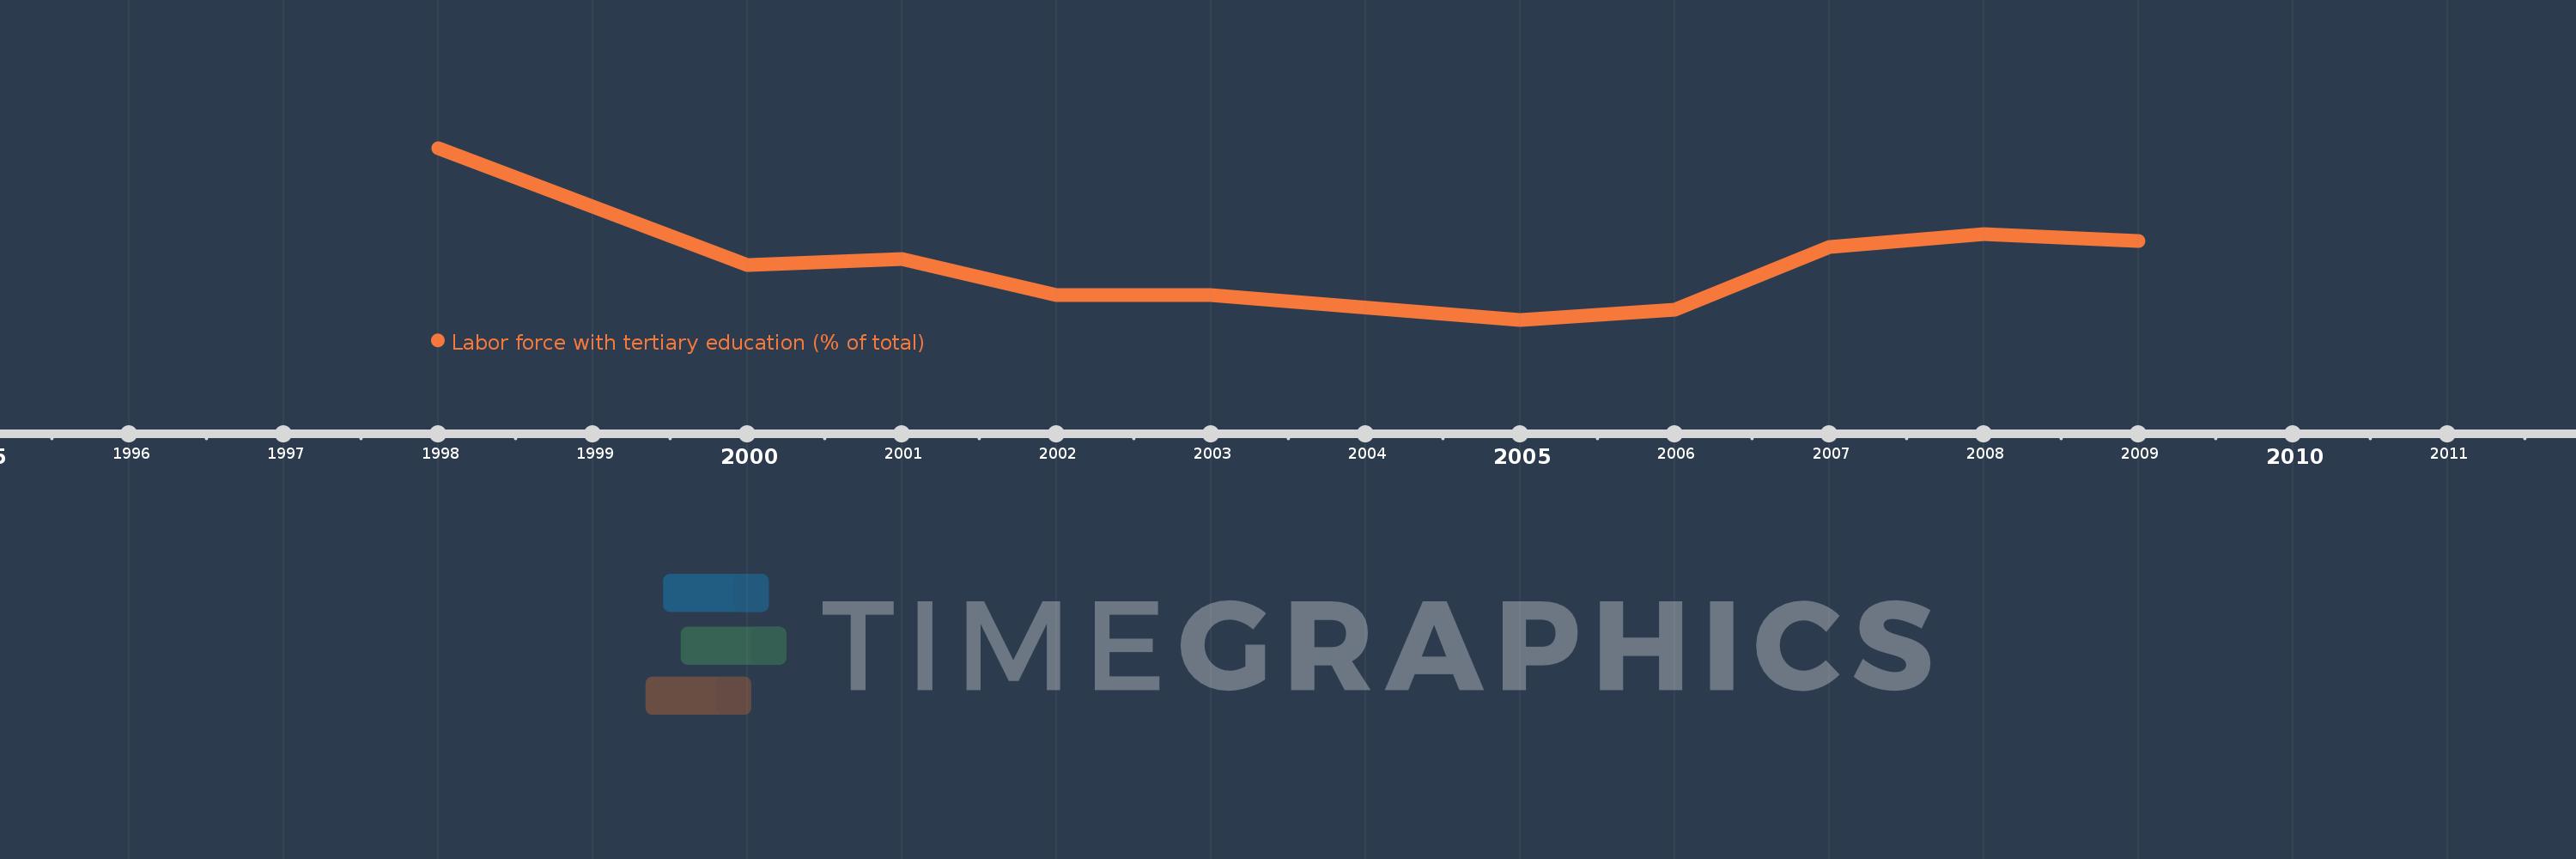
Labor force with tertiary education (% of total)
2009,2008,2007,2006,2005,2003,2002,2001,2000,1998
Estas estadísticas en otros países:
línea de tiempo (timeline):
En esta escala de tiempo se presenta un gráfico de 1998 y 2009 de New Zealand. Los datos de 1997 están ausentes. El número de observaciones reales por fecha: 10.
Fuente (nombre):
Indicadores del desarrollo mundial
Fuente (organización):
International Labour Organization, Key Indicators of the Labour Market database.
Categorías:
Education, Social Protection & Labor
Se ha actualizado:
23 abr 2017 año
Los indicadores de los cambios de valor en los últimos años
Mínimo:
23.2
1 ene 2005 año
Máximo:
51.4
1 ene 1998 año
A la fecha de observación
Valor
Cambio absoluto
El cambio con respecto al valor anterior
1 ene 1998 año
51.4
+51.4
0.0%
1 ene 2000 año
32.2
-19.2
-37.35%
1 ene 2001 año
33.2
+1.0
3.11%
1 ene 2002 año
27.2
-6.0
-18.07%
1 ene 2003 año
27.3
+0.1
0.37%
1 ene 2005 año
23.2
-4.1
-15.02%
1 ene 2006 año
24.8
+1.6
6.9%
1 ene 2007 año
35.1
+10.3
41.53%
1 ene 2008 año
37.3
+2.2
6.27%
1 ene 2009 año
36.2
-1.1
-2.95%
Ranking de los países por los datos estadísticos actuales


Comentarios: