29
/es/
es
AIzaSyAYiBZKx7MnpbEhh9jyipgxe19OcubqV5w
April 1, 2024
30677
Europe & Central Asia
ECS
false
2
1
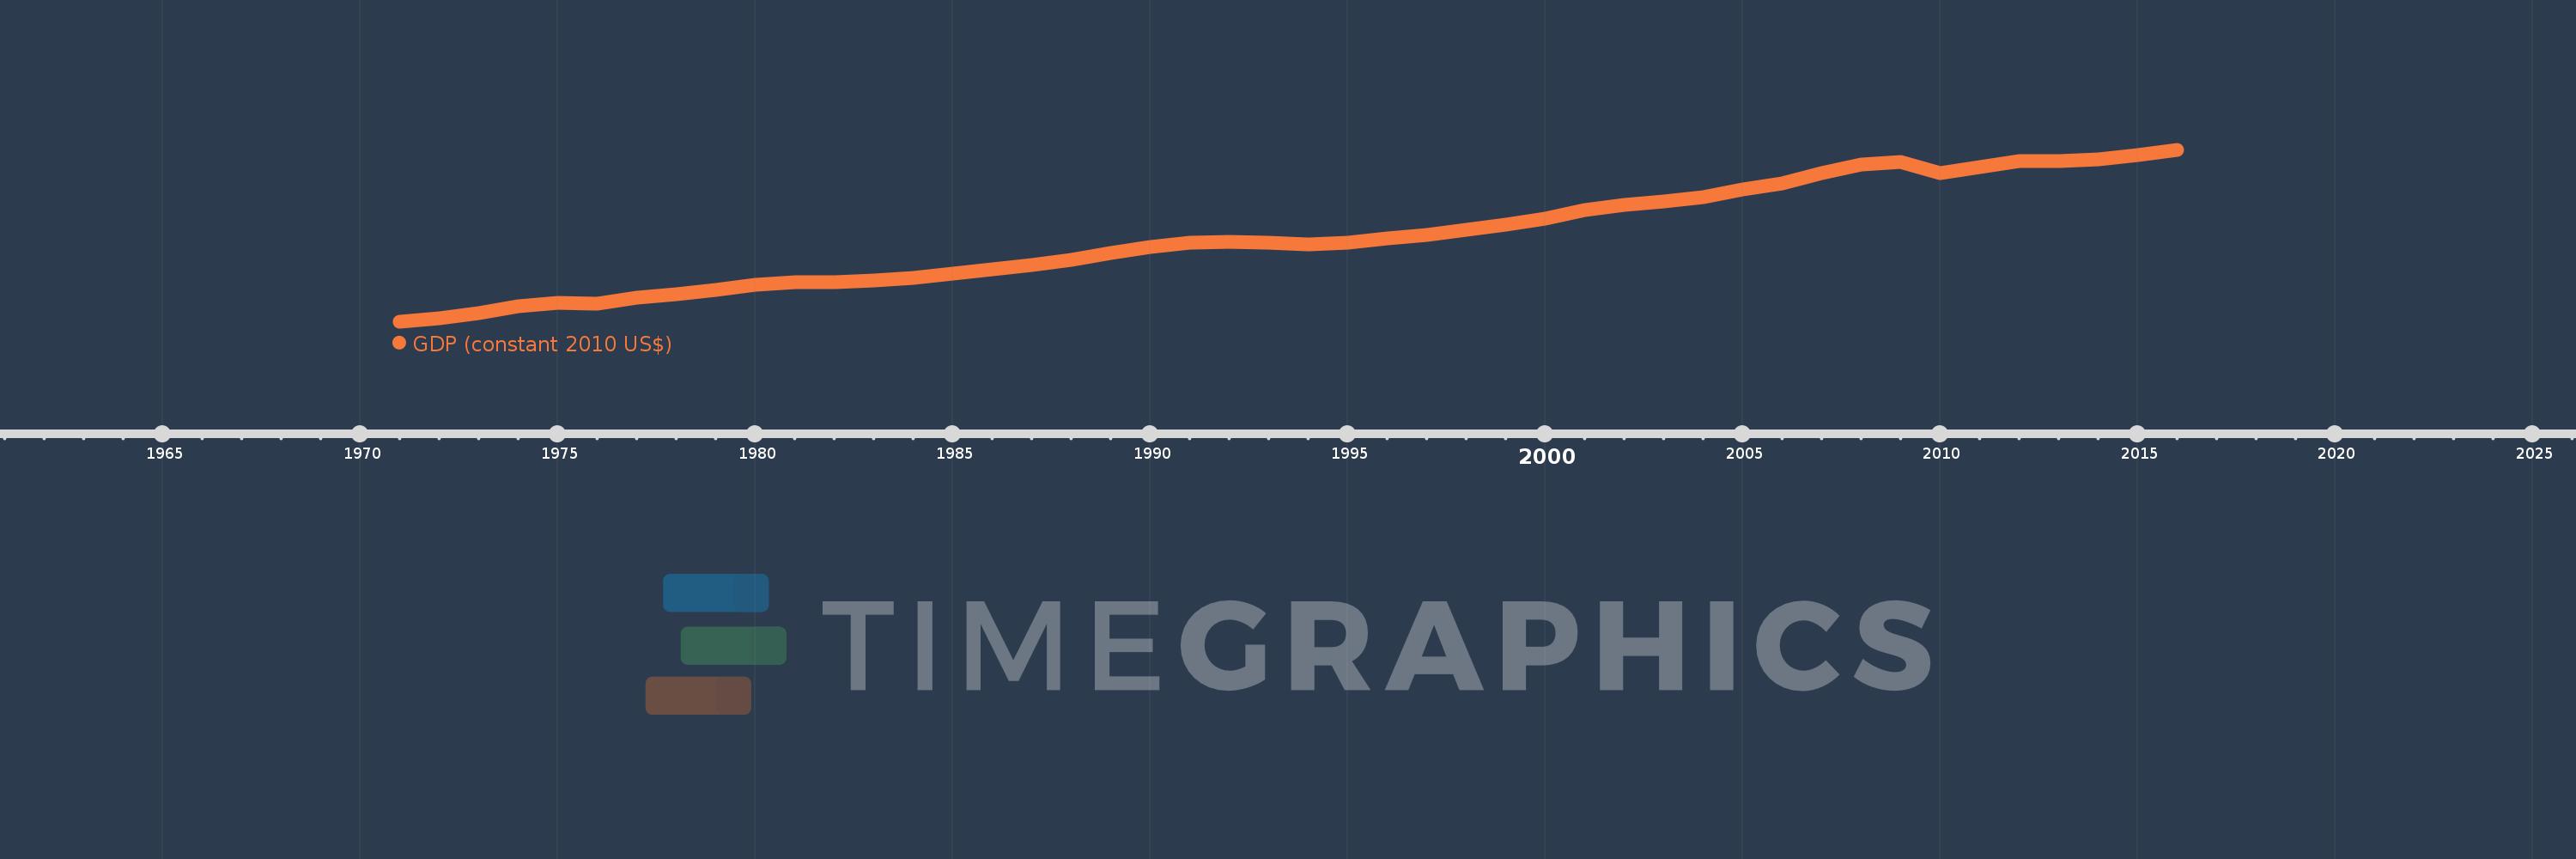
GDP (constant 2010 US$)
2016,2015,2014,2013,2012,2011,2010,2009,2008,2007,2006,2005,2004,2003,2002,2001,2000,1999,1998,1997,1996,1995,1994,1993,1992,1991,1990,1989,1988,1987,1986,1985,1984,1983,1982,1981,1980,1979,1978,1977,1976,1975,1974,1973,1972,1971
Estas estadísticas en otros países:
AfghanistanAlbaniaAlgeriaAndorraAngolaAntigua and BarbudaArab WorldArgentinaArmeniaArubaAustraliaAustriaAzerbaijanBahamas, TheBahrainBangladeshBarbadosBelarusBelgiumBelizeBeninBermudaBhutanBoliviaBosnia and HerzegovinaBotswanaBrazilBrunei DarussalamBulgariaBurkina FasoBurundiCabo VerdeCambodiaCameroonCanadaCaribbean small statesCentral African RepublicCentral Europe and the BalticsChadChileChinaColombiaComorosCongo, Dem. Rep.Congo, Rep.Costa RicaCote d'IvoireCroatiaCubaCyprusCzech RepublicDenmarkDjiboutiDominicaDominican RepublicEarly-demographic dividendEast Asia & PacificEast Asia & Pacific (excluding high income)East Asia & Pacific (IDA & IBRD countries)EcuadorEgypt, Arab Rep.El SalvadorEquatorial GuineaEritreaEstoniaEthiopiaEuro areaEurope & Central AsiaEurope & Central Asia (excluding high income)Europe & Central Asia (IDA & IBRD countries)European UnionFaroe IslandsFijiFinlandFragile and conflict affected situationsFranceGabonGambia, TheGeorgiaGermanyGhanaGreeceGreenlandGrenadaGuatemalaGuineaGuinea-BissauGuyanaHaitiHeavily indebted poor countries (HIPC)High incomeHondurasHong Kong SAR, ChinaHungaryIBRD onlyIcelandIDA & IBRD totalIDA blendIDA onlyIDA totalIndiaIndonesiaIran, Islamic Rep.IraqIrelandIsle of ManIsraelItalyJamaicaJapanJordanKazakhstanKenyaKiribatiKorea, Rep.KosovoKuwaitKyrgyz RepublicLao PDRLate-demographic dividendLatin America & Caribbean Latin America & Caribbean (excluding high income)Latin America & the Caribbean (IDA & IBRD countries)LatviaLeast developed countries: UN classificationLebanonLesothoLiberiaLibyaLiechtensteinLithuaniaLow & middle incomeLow incomeLower middle incomeLuxembourgMacao SAR, ChinaMacedonia, FYRMadagascarMalawiMalaysiaMaldivesMaliMaltaMarshall IslandsMauritaniaMauritiusMexicoMicronesia, Fed. Sts.Middle East & North AfricaMiddle East & North Africa (excluding high income)Middle East & North Africa (IDA & IBRD countries)Middle incomeMoldovaMonacoMongoliaMontenegroMoroccoMozambiqueMyanmarNamibiaNauruNepalNetherlandsNew ZealandNicaraguaNigerNigeriaNorth AmericaNorwayOECD membersOmanOther small statesPacific island small statesPakistanPalauPanamaPapua New GuineaParaguayPeruPhilippinesPolandPortugalPost-demographic dividendPre-demographic dividendPuerto RicoQatarRomaniaRussian FederationRwandaSamoaSao Tome and PrincipeSaudi ArabiaSenegalSerbiaSeychellesSierra LeoneSingaporeSlovak RepublicSloveniaSmall statesSolomon IslandsSouth AfricaSouth AsiaSouth Asia (IDA & IBRD)South SudanSpainSri LankaSt. Kitts and NevisSt. LuciaSt. Vincent and the GrenadinesSub-Saharan Africa Sub-Saharan Africa (excluding high income)Sub-Saharan Africa (IDA & IBRD countries)SudanSurinameSwazilandSwedenSwitzerlandTajikistanTanzaniaThailandTimor-LesteTogoTongaTrinidad and TobagoTunisiaTurkeyTurkmenistanTuvaluUgandaUkraineUnited Arab EmiratesUnited KingdomUnited StatesUpper middle incomeUruguayUzbekistanVanuatuVenezuela, RBVietnamWest Bank and GazaWorldYemen, Rep.ZambiaZimbabwe línea de tiempo (timeline):
En esta escala de tiempo se presenta un gráfico de 1971 y 2016 de Europe & Central Asia. Los datos de 1970 están ausentes. El número de observaciones reales por fecha: 46.
Fuente (nombre):
Indicadores del desarrollo mundial
Fuente (organización):
World Bank national accounts data, and OECD National Accounts data files.
Categorías:
Economy & Growth
Se ha actualizado:
23 abr 2017 año
Los indicadores de los cambios de valor en los últimos años
En promedio:
15.252 billones
Mínimo:
8.439 billones
1 ene 1971 año
Máximo:
22.196 billones
1 ene 2016 año
A la fecha de observación
Valor
Cambio absoluto
El cambio con respecto al valor anterior
1 ene 1971 año
8.439 billones
+8.439 billones
0.0%
1 ene 1972 año
8.753 billones
+314.161 bn
3.72%
1 ene 1973 año
9.172 billones
+419.22 bn
4.79%
1 ene 1974 año
9.723 billones
+550.851 bn
6.01%
1 ene 1975 año
9.951 billones
+228.251 bn
2.35%
1 ene 1976 año
9.904 billones
-47.179 bn
-0.47%
1 ene 1977 año
10.377 billones
+472.357 bn
4.77%
1 ene 1978 año
10.674 billones
+297.521 bn
2.87%
1 ene 1979 año
11.016 billones
+341.743 bn
3.2%
1 ene 1980 año
11.427 billones
+411.61 bn
3.74%
1 ene 1981 año
11.593 billones
+165.448 bn
1.45%
1 ene 1982 año
11.651 billones
+58.452 bn
0.5%
1 ene 1983 año
11.762 billones
+110.647 bn
0.95%
1 ene 1984 año
11.987 billones
+225.202 bn
1.91%
1 ene 1985 año
12.306 billones
+318.844 bn
2.66%
1 ene 1986 año
12.646 billones
+340.062 bn
2.76%
1 ene 1987 año
12.996 billones
+350.034 bn
2.77%
1 ene 1988 año
13.391 billones
+395.357 bn
3.04%
1 ene 1989 año
13.952 billones
+560.835 bn
4.19%
1 ene 1990 año
14.449 billones
+496.682 bn
3.56%
1 ene 1991 año
14.784 billones
+334.739 bn
2.32%
1 ene 1992 año
14.848 billones
+64.452 bn
0.44%
1 ene 1993 año
14.757 billones
-90.906 bn
-0.61%
1 ene 1994 año
14.632 billones
-125.702 bn
-0.85%
1 ene 1995 año
14.791 billones
+159.153 bn
1.09%
1 ene 1996 año
15.109 billones
+318.799 bn
2.16%
1 ene 1997 año
15.379 billones
+269.265 bn
1.78%
1 ene 1998 año
15.819 billones
+440.426 bn
2.86%
1 ene 1999 año
16.212 billones
+392.368 bn
2.48%
1 ene 2000 año
16.686 billones
+474.039 bn
2.92%
1 ene 2001 año
17.406 billones
+720.458 bn
4.32%
1 ene 2002 año
17.798 billones
+391.928 bn
2.25%
1 ene 2003 año
18.104 billones
+305.797 bn
1.72%
1 ene 2004 año
18.443 billones
+339.3 bn
1.87%
1 ene 2005 año
19.043 billones
+600.4 bn
3.26%
1 ene 2006 año
19.559 billones
+516.006 bn
2.71%
1 ene 2007 año
20.328 billones
+768.356 bn
3.93%
1 ene 2008 año
21.078 billones
+750.446 bn
3.69%
1 ene 2009 año
21.284 billones
+206.179 bn
0.98%
1 ene 2010 año
20.327 billones
-957.933 bn
-4.5%
1 ene 2011 año
20.86 billones
+533.793 bn
2.63%
1 ene 2012 año
21.319 billones
+458.89 bn
2.2%
1 ene 2013 año
21.35 billones
+30.946 bn
0.15%
1 ene 2014 año
21.481 billones
+130.682 bn
0.61%
1 ene 2015 año
21.825 billones
+343.809 bn
1.6%
1 ene 2016 año
22.196 billones
+371.432 bn
1.7%
Ranking de los países por los datos estadísticos actuales


Comentarios: