29
/es/
es
AIzaSyAYiBZKx7MnpbEhh9jyipgxe19OcubqV5w
April 1, 2024
247540
Spain
ESP
true
2
1
GDP (constant 2010 US$)
2016,2015,2014,2013,2012,2011,2010,2009,2008,2007,2006,2005,2004,2003,2002,2001,2000,1999,1998,1997,1996,1995,1994,1993,1992,1991,1990,1989,1988,1987,1986,1985,1984,1983,1982,1981,1980,1979,1978,1977,1976,1975,1974,1973,1972,1971,1970,1969,1968,1967,1966,1965,1964,1963,1962,1961
Estas estadísticas en otros países:
AfghanistanAlbaniaAlgeriaAndorraAngolaAntigua and BarbudaArab WorldArgentinaArmeniaArubaAustraliaAustriaAzerbaijanBahamas, TheBahrainBangladeshBarbadosBelarusBelgiumBelizeBeninBermudaBhutanBoliviaBosnia and HerzegovinaBotswanaBrazilBrunei DarussalamBulgariaBurkina FasoBurundiCabo VerdeCambodiaCameroonCanadaCaribbean small statesCentral African RepublicCentral Europe and the BalticsChadChileChinaColombiaComorosCongo, Dem. Rep.Congo, Rep.Costa RicaCote d'IvoireCroatiaCubaCyprusCzech RepublicDenmarkDjiboutiDominicaDominican RepublicEarly-demographic dividendEast Asia & PacificEast Asia & Pacific (excluding high income)East Asia & Pacific (IDA & IBRD countries)EcuadorEgypt, Arab Rep.El SalvadorEquatorial GuineaEritreaEstoniaEthiopiaEuro areaEurope & Central AsiaEurope & Central Asia (excluding high income)Europe & Central Asia (IDA & IBRD countries)European UnionFaroe IslandsFijiFinlandFragile and conflict affected situationsFranceGabonGambia, TheGeorgiaGermanyGhanaGreeceGreenlandGrenadaGuatemalaGuineaGuinea-BissauGuyanaHaitiHeavily indebted poor countries (HIPC)High incomeHondurasHong Kong SAR, ChinaHungaryIBRD onlyIcelandIDA & IBRD totalIDA blendIDA onlyIDA totalIndiaIndonesiaIran, Islamic Rep.IraqIrelandIsle of ManIsraelItalyJamaicaJapanJordanKazakhstanKenyaKiribatiKorea, Rep.KosovoKuwaitKyrgyz RepublicLao PDRLate-demographic dividendLatin America & Caribbean Latin America & Caribbean (excluding high income)Latin America & the Caribbean (IDA & IBRD countries)LatviaLeast developed countries: UN classificationLebanonLesothoLiberiaLibyaLiechtensteinLithuaniaLow & middle incomeLow incomeLower middle incomeLuxembourgMacao SAR, ChinaMacedonia, FYRMadagascarMalawiMalaysiaMaldivesMaliMaltaMarshall IslandsMauritaniaMauritiusMexicoMicronesia, Fed. Sts.Middle East & North AfricaMiddle East & North Africa (excluding high income)Middle East & North Africa (IDA & IBRD countries)Middle incomeMoldovaMonacoMongoliaMontenegroMoroccoMozambiqueMyanmarNamibiaNauruNepalNetherlandsNew ZealandNicaraguaNigerNigeriaNorth AmericaNorwayOECD membersOmanOther small statesPacific island small statesPakistanPalauPanamaPapua New GuineaParaguayPeruPhilippinesPolandPortugalPost-demographic dividendPre-demographic dividendPuerto RicoQatarRomaniaRussian FederationRwandaSamoaSao Tome and PrincipeSaudi ArabiaSenegalSerbiaSeychellesSierra LeoneSingaporeSlovak RepublicSloveniaSmall statesSolomon IslandsSouth AfricaSouth AsiaSouth Asia (IDA & IBRD)South SudanSpainSri LankaSt. Kitts and NevisSt. LuciaSt. Vincent and the GrenadinesSub-Saharan Africa Sub-Saharan Africa (excluding high income)Sub-Saharan Africa (IDA & IBRD countries)SudanSurinameSwazilandSwedenSwitzerlandTajikistanTanzaniaThailandTimor-LesteTogoTongaTrinidad and TobagoTunisiaTurkeyTurkmenistanTuvaluUgandaUkraineUnited Arab EmiratesUnited KingdomUnited StatesUpper middle incomeUruguayUzbekistanVanuatuVenezuela, RBVietnamWest Bank and GazaWorldYemen, Rep.ZambiaZimbabwe línea de tiempo (timeline):
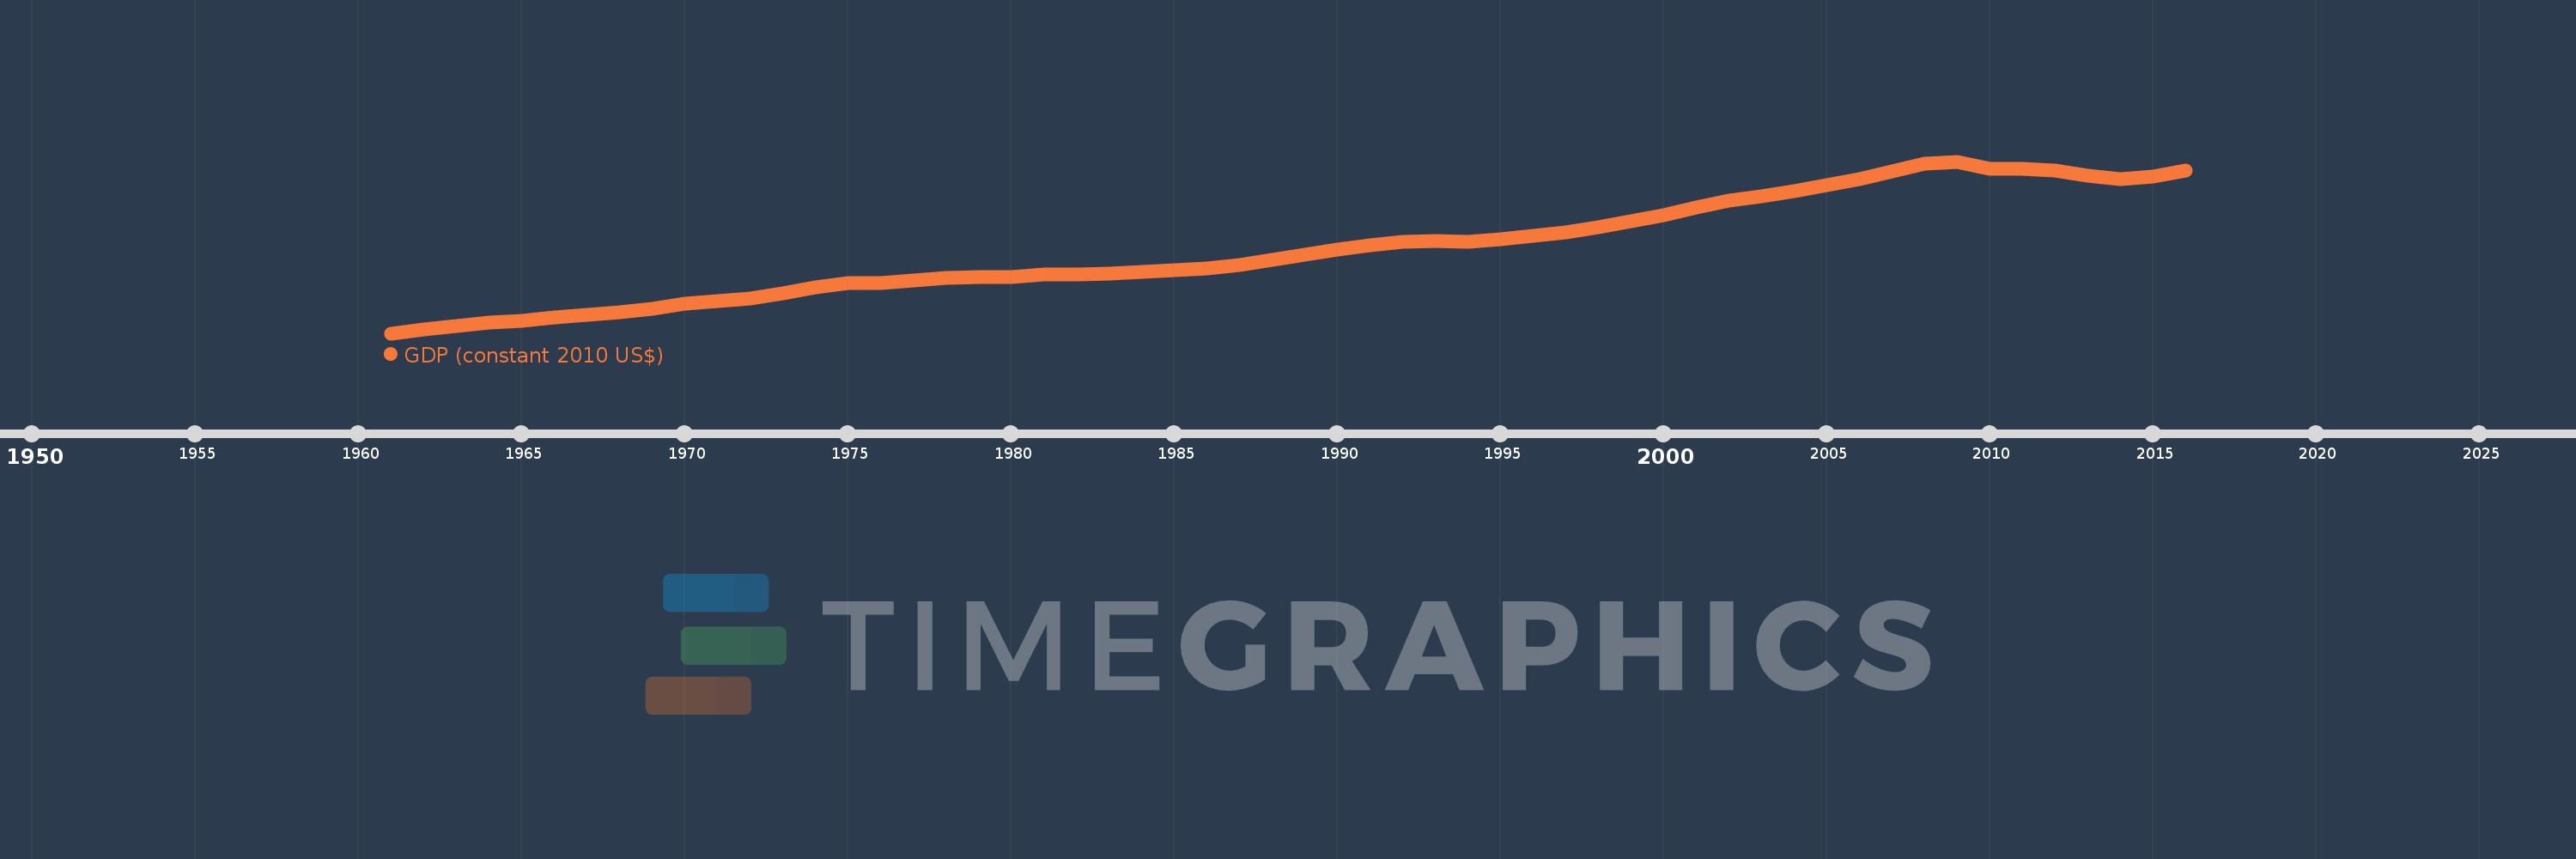
En esta escala de tiempo se presenta un gráfico de 1961 y 2016 de Spain. Los datos de 1960 están ausentes. El número de observaciones reales por fecha: 56.
Fuente (nombre):
Indicadores del desarrollo mundial
Fuente (organización):
World Bank national accounts data, and OECD National Accounts data files.
Categorías:
Economy & Growth
Se ha actualizado:
23 abr 2017 año
Los indicadores de los cambios de valor en los últimos años
Mínimo:
224.161 bn
1 ene 1961 año
Máximo:
1.485 billones
1 ene 2009 año
A la fecha de observación
Valor
Cambio absoluto
El cambio con respecto al valor anterior
1 ene 1961 año
224.161 bn
+224.161 bn
0.0%
1 ene 1962 año
250.699 bn
+26.538 bn
11.84%
1 ene 1963 año
275.652 bn
+24.953 bn
9.95%
1 ene 1964 año
302.105 bn
+26.453 bn
9.6%
1 ene 1965 año
318.142 bn
+16.037 bn
5.31%
1 ene 1966 año
338.036 bn
+19.894 bn
6.25%
1 ene 1967 año
362.53 bn
+24.494 bn
7.25%
1 ene 1968 año
378.265 bn
+15.735 bn
4.34%
1 ene 1969 año
403.219 bn
+24.954 bn
6.6%
1 ene 1970 año
439.134 bn
+35.915 bn
8.91%
1 ene 1971 año
457.977 bn
+18.843 bn
4.29%
1 ene 1972 año
479.27 bn
+21.294 bn
4.65%
1 ene 1973 año
518.33 bn
+39.059 bn
8.15%
1 ene 1974 año
558.7 bn
+40.37 bn
7.79%
1 ene 1975 año
590.092 bn
+31.392 bn
5.62%
1 ene 1976 año
593.291 bn
+3.199 bn
0.54%
1 ene 1977 año
612.892 bn
+19.601 bn
3.3%
1 ene 1978 año
630.29 bn
+17.397 bn
2.84%
1 ene 1979 año
639.511 bn
+9.221 bn
1.46%
1 ene 1980 año
639.777 bn
+265.694 millones
0.04%
1 ene 1981 año
653.908 bn
+14.131 bn
2.21%
1 ene 1982 año
653.041 bn
-866.222 millones
-0.13%
1 ene 1983 año
661.181 bn
+8.14 bn
1.25%
1 ene 1984 año
672.885 bn
+11.704 bn
1.77%
1 ene 1985 año
684.894 bn
+12.009 bn
1.78%
1 ene 1986 año
700.793 bn
+15.899 bn
2.32%
1 ene 1987 año
723.592 bn
+22.799 bn
3.25%
1 ene 1988 año
763.731 bn
+40.139 bn
5.55%
1 ene 1989 año
802.638 bn
+38.907 bn
5.09%
1 ene 1990 año
841.381 bn
+38.744 bn
4.83%
1 ene 1991 año
873.197 bn
+31.816 bn
3.78%
1 ene 1992 año
895.429 bn
+22.232 bn
2.55%
1 ene 1993 año
903.749 bn
+8.32 bn
0.93%
1 ene 1994 año
894.427 bn
-9.322 bn
-1.03%
1 ene 1995 año
915.743 bn
+21.316 bn
2.38%
1 ene 1996 año
940.995 bn
+25.252 bn
2.76%
1 ene 1997 año
966.163 bn
+25.168 bn
2.67%
1 ene 1998 año
1.002 billones
+35.648 bn
3.69%
1 ene 1999 año
1.045 billones
+43.138 bn
4.31%
1 ene 2000 año
1.092 billones
+46.865 bn
4.48%
1 ene 2001 año
1.15 billones
+57.747 bn
5.29%
1 ene 2002 año
1.196 billones
+45.995 bn
4.0%
1 ene 2003 año
1.23 billones
+34.429 bn
2.88%
1 ene 2004 año
1.269 billones
+39.207 bn
3.19%
1 ene 2005 año
1.309 billones
+40.192 bn
3.17%
1 ene 2006 año
1.358 billones
+48.75 bn
3.72%
1 ene 2007 año
1.415 billones
+56.69 bn
4.17%
1 ene 2008 año
1.468 billones
+53.323 bn
3.77%
1 ene 2009 año
1.485 billones
+16.384 bn
1.12%
1 ene 2010 año
1.431 billones
-53.054 bn
-3.57%
1 ene 2011 año
1.432 billones
+197.351 millones
0.01%
1 ene 2012 año
1.417 billones
-14.318 bn
-1.0%
1 ene 2013 año
1.38 billones
-37.139 bn
-2.62%
1 ene 2014 año
1.357 billones
-23.077 bn
-1.67%
1 ene 2015 año
1.376 billones
+18.466 bn
1.36%
1 ene 2016 año
1.42 billones
+44.216 bn
3.21%
Ranking de los países por los datos estadísticos actuales


Comentarios: