29
/es/
es
AIzaSyAYiBZKx7MnpbEhh9jyipgxe19OcubqV5w
April 1, 2024
138016
Georgia
GEO
true
2
1
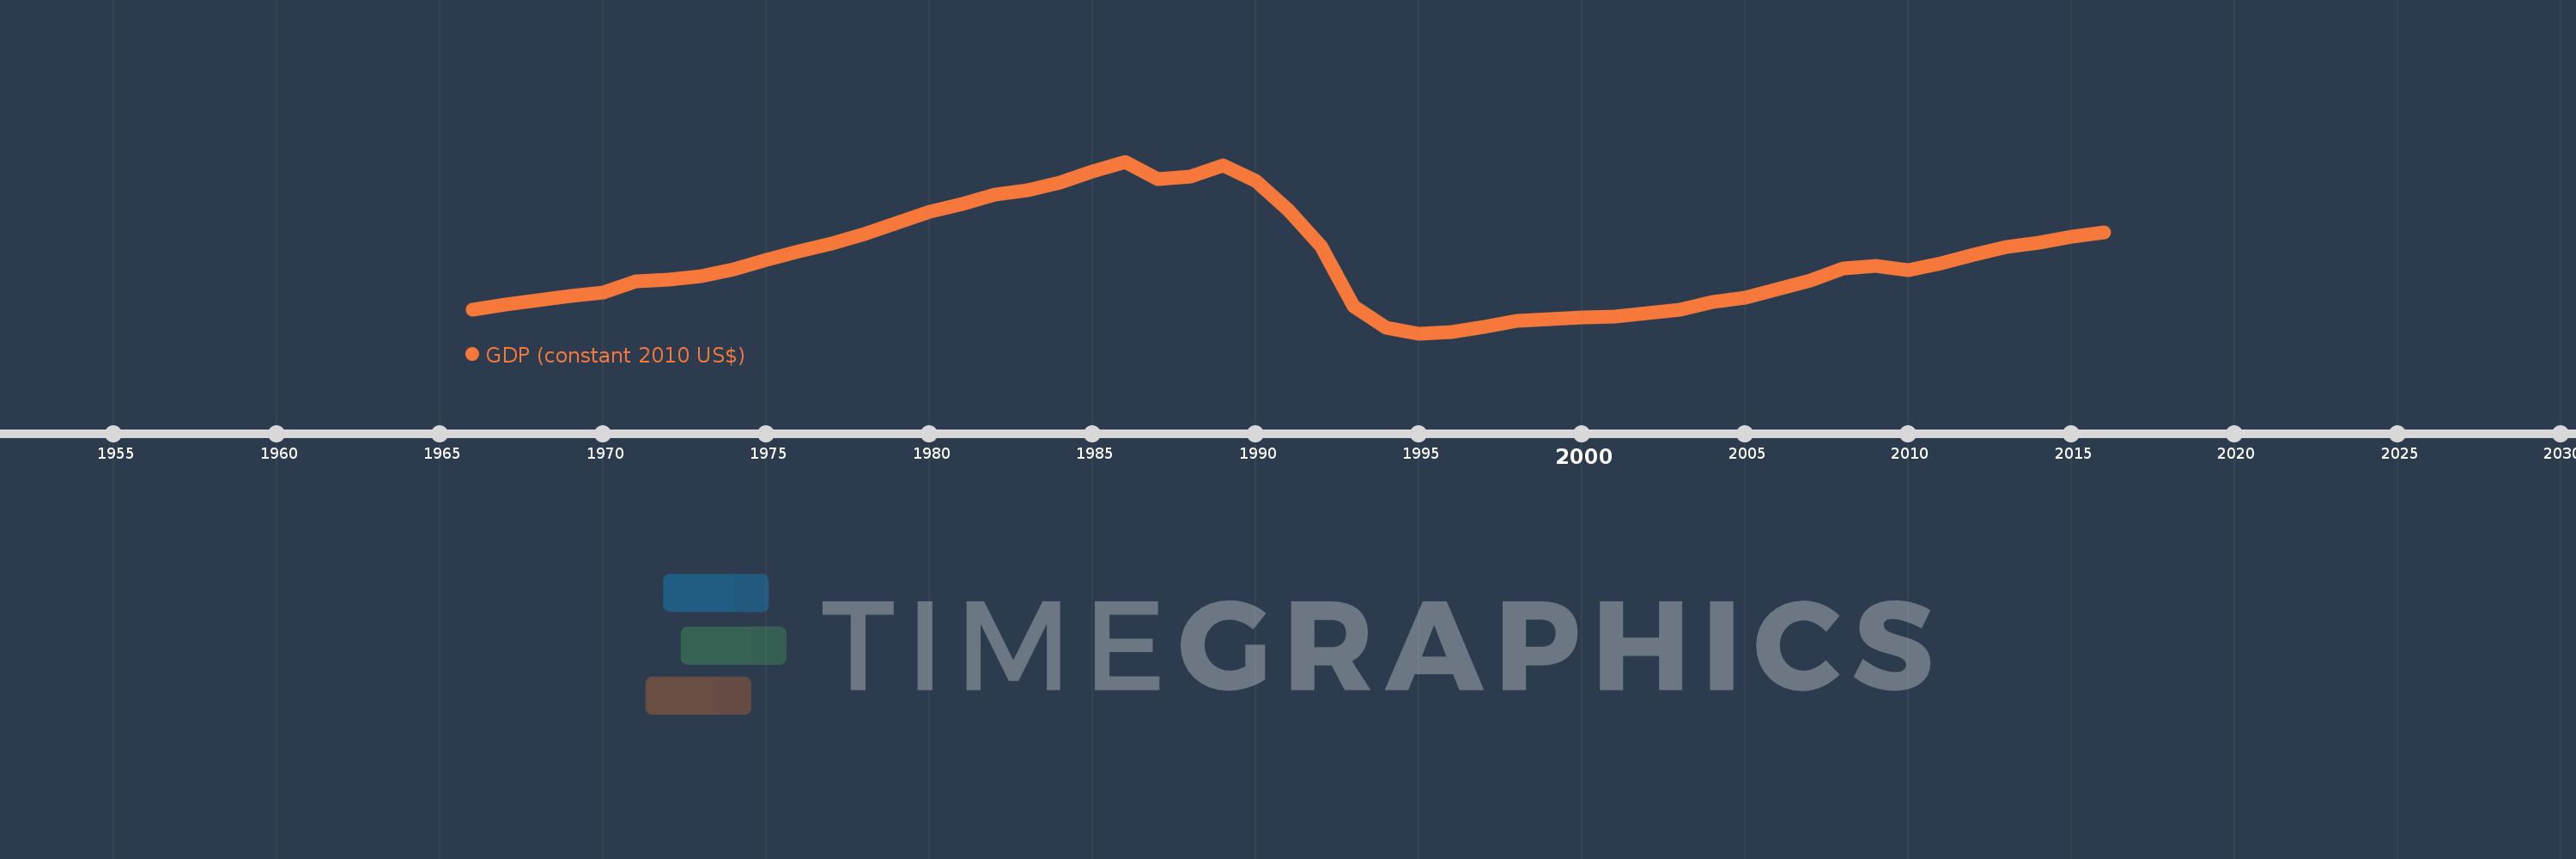
GDP (constant 2010 US$)
2016,2015,2014,2013,2012,2011,2010,2009,2008,2007,2006,2005,2004,2003,2002,2001,2000,1999,1998,1997,1996,1995,1994,1993,1992,1991,1990,1989,1988,1987,1986,1985,1984,1983,1982,1981,1980,1979,1978,1977,1976,1975,1974,1973,1972,1971,1970,1969,1968,1967,1966
Estas estadísticas en otros países:
AfghanistanAlbaniaAlgeriaAndorraAngolaAntigua and BarbudaArab WorldArgentinaArmeniaArubaAustraliaAustriaAzerbaijanBahamas, TheBahrainBangladeshBarbadosBelarusBelgiumBelizeBeninBermudaBhutanBoliviaBosnia and HerzegovinaBotswanaBrazilBrunei DarussalamBulgariaBurkina FasoBurundiCabo VerdeCambodiaCameroonCanadaCaribbean small statesCentral African RepublicCentral Europe and the BalticsChadChileChinaColombiaComorosCongo, Dem. Rep.Congo, Rep.Costa RicaCote d'IvoireCroatiaCubaCyprusCzech RepublicDenmarkDjiboutiDominicaDominican RepublicEarly-demographic dividendEast Asia & PacificEast Asia & Pacific (excluding high income)East Asia & Pacific (IDA & IBRD countries)EcuadorEgypt, Arab Rep.El SalvadorEquatorial GuineaEritreaEstoniaEthiopiaEuro areaEurope & Central AsiaEurope & Central Asia (excluding high income)Europe & Central Asia (IDA & IBRD countries)European UnionFaroe IslandsFijiFinlandFragile and conflict affected situationsFranceGabonGambia, TheGeorgiaGermanyGhanaGreeceGreenlandGrenadaGuatemalaGuineaGuinea-BissauGuyanaHaitiHeavily indebted poor countries (HIPC)High incomeHondurasHong Kong SAR, ChinaHungaryIBRD onlyIcelandIDA & IBRD totalIDA blendIDA onlyIDA totalIndiaIndonesiaIran, Islamic Rep.IraqIrelandIsle of ManIsraelItalyJamaicaJapanJordanKazakhstanKenyaKiribatiKorea, Rep.KosovoKuwaitKyrgyz RepublicLao PDRLate-demographic dividendLatin America & Caribbean Latin America & Caribbean (excluding high income)Latin America & the Caribbean (IDA & IBRD countries)LatviaLeast developed countries: UN classificationLebanonLesothoLiberiaLibyaLiechtensteinLithuaniaLow & middle incomeLow incomeLower middle incomeLuxembourgMacao SAR, ChinaMacedonia, FYRMadagascarMalawiMalaysiaMaldivesMaliMaltaMarshall IslandsMauritaniaMauritiusMexicoMicronesia, Fed. Sts.Middle East & North AfricaMiddle East & North Africa (excluding high income)Middle East & North Africa (IDA & IBRD countries)Middle incomeMoldovaMonacoMongoliaMontenegroMoroccoMozambiqueMyanmarNamibiaNauruNepalNetherlandsNew ZealandNicaraguaNigerNigeriaNorth AmericaNorwayOECD membersOmanOther small statesPacific island small statesPakistanPalauPanamaPapua New GuineaParaguayPeruPhilippinesPolandPortugalPost-demographic dividendPre-demographic dividendPuerto RicoQatarRomaniaRussian FederationRwandaSamoaSao Tome and PrincipeSaudi ArabiaSenegalSerbiaSeychellesSierra LeoneSingaporeSlovak RepublicSloveniaSmall statesSolomon IslandsSouth AfricaSouth AsiaSouth Asia (IDA & IBRD)South SudanSpainSri LankaSt. Kitts and NevisSt. LuciaSt. Vincent and the GrenadinesSub-Saharan Africa Sub-Saharan Africa (excluding high income)Sub-Saharan Africa (IDA & IBRD countries)SudanSurinameSwazilandSwedenSwitzerlandTajikistanTanzaniaThailandTimor-LesteTogoTongaTrinidad and TobagoTunisiaTurkeyTurkmenistanTuvaluUgandaUkraineUnited Arab EmiratesUnited KingdomUnited StatesUpper middle incomeUruguayUzbekistanVanuatuVenezuela, RBVietnamWest Bank and GazaWorldYemen, Rep.ZambiaZimbabwe línea de tiempo (timeline):
En esta escala de tiempo se presenta un gráfico de 1966 y 2016 de Georgia. Los datos de 1965 están ausentes. El número de observaciones reales por fecha: 51.
Fuente (nombre):
Indicadores del desarrollo mundial
Fuente (organización):
World Bank national accounts data, and OECD National Accounts data files.
Categorías:
Economy & Growth
Se ha actualizado:
23 abr 2017 año
Los indicadores de los cambios de valor en los últimos años
Mínimo:
4.667 bn
1 ene 1995 año
Máximo:
21.83 bn
1 ene 1986 año
A la fecha de observación
Valor
Cambio absoluto
El cambio con respecto al valor anterior
1 ene 1966 año
7.01 bn
+7.01 bn
0.0%
1 ene 1967 año
7.539 bn
+528.271 millones
7.54%
1 ene 1968 año
8.01 bn
+471.161 millones
6.25%
1 ene 1969 año
8.367 bn
+356.941 millones
4.46%
1 ene 1970 año
8.766 bn
+399.772 millones
4.78%
1 ene 1971 año
9.823 bn
+1.057 bn
12.05%
1 ene 1972 año
10.066 bn
+242.72 millones
2.47%
1 ene 1973 año
10.351 bn
+285.552 millones
2.84%
1 ene 1974 año
11.022 bn
+671.048 millones
6.48%
1 ene 1975 año
11.993 bn
+970.878 millones
8.81%
1 ene 1976 año
12.878 bn
+885.211 millones
7.38%
1 ene 1977 año
13.664 bn
+785.269 millones
6.1%
1 ene 1978 año
14.606 bn
+942.322 millones
6.9%
1 ene 1979 año
15.691 bn
+1.085 bn
7.43%
1 ene 1980 año
16.848 bn
+1.156 bn
7.37%
1 ene 1981 año
17.619 bn
+770.99 millones
4.58%
1 ene 1982 año
18.547 bn
+928.044 millones
5.27%
1 ene 1983 año
18.918 bn
+371.218 millones
2.0%
1 ene 1984 año
19.732 bn
+813.824 millones
4.3%
1 ene 1985 año
20.802 bn
+1.071 bn
5.43%
1 ene 1986 año
21.83 bn
+1.028 bn
4.94%
1 ene 1987 año
20.046 bn
-1.785 bn
-8.18%
1 ene 1988 año
20.303 bn
+256.995 millones
1.28%
1 ene 1989 año
21.431 bn
+1.128 bn
5.56%
1 ene 1990 año
19.889 bn
-1.542 bn
-7.2%
1 ene 1991 año
16.948 bn
-2.941 bn
-14.79%
1 ene 1992 año
13.372 bn
-3.576 bn
-21.1%
1 ene 1993 año
7.368 bn
-6.004 bn
-44.9%
1 ene 1994 año
5.209 bn
-2.159 bn
-29.3%
1 ene 1995 año
4.667 bn
-541.735 millones
-10.4%
1 ene 1996 año
4.789 bn
+121.349 millones
2.6%
1 ene 1997 año
5.325 bn
+536.324 millones
11.2%
1 ene 1998 año
5.885 bn
+560.132 millones
10.52%
1 ene 1999 año
6.068 bn
+182.726 millones
3.1%
1 ene 2000 año
6.242 bn
+174.101 millones
2.87%
1 ene 2001 año
6.357 bn
+114.747 millones
1.84%
1 ene 2002 año
6.662 bn
+305.465 millones
4.81%
1 ene 2003 año
7.027 bn
+364.673 millones
5.47%
1 ene 2004 año
7.804 bn
+777.028 millones
11.06%
1 ene 2005 año
8.261 bn
+457.095 millones
5.86%
1 ene 2006 año
9.054 bn
+793.017 millones
9.6%
1 ene 2007 año
9.903 bn
+849.554 millones
9.38%
1 ene 2008 año
11.126 bn
+1.222 bn
12.34%
1 ene 2009 año
11.383 bn
+257.46 millones
2.31%
1 ene 2010 año
10.954 bn
-429.812 millones
-3.78%
1 ene 2011 año
11.639 bn
+684.932 millones
6.25%
1 ene 2012 año
12.479 bn
+840.48 millones
7.22%
1 ene 2013 año
13.271 bn
+792.478 millones
6.35%
1 ene 2014 año
13.721 bn
+449.511 millones
3.39%
1 ene 2015 año
14.355 bn
+634.368 millones
4.62%
1 ene 2016 año
14.754 bn
+398.351 millones
2.77%
Ranking de los países por los datos estadísticos actuales


Comentarios: