30
/es/
AIzaSyAYiBZKx7MnpbEhh9jyipgxe19OcubqV5w
April 1, 2024
30158
Euro area
EMU
false
2
1
Net trade in goods and services (BoP, current US$)
2016,2015,2014,2013,2012,2011,2010,2009,2008,2007,2006,2005,2004,2003,2002,2001
Download
Estadísticas Globales de la Biblioteca →Euro area →

Net trade in goods and services (BoP, current US$)

Estas estadísticas en otros países:

AfghanistanAlbaniaAlgeriaAngolaAntigua and BarbudaArgentinaArmeniaArubaAustraliaAustriaAzerbaijanBahamas, TheBahrainBangladeshBarbadosBelarusBelgiumBelizeBeninBermudaBhutanBoliviaBosnia and HerzegovinaBotswanaBrazilBrunei DarussalamBulgariaBurkina FasoBurundiCabo VerdeCambodiaCameroonCanadaCentral African RepublicChadChileChinaColombiaComorosCongo, Dem. Rep.Congo, Rep.Costa RicaCote d'IvoireCroatiaCuracaoCyprusCzech RepublicDenmarkDjiboutiDominicaDominican RepublicEcuadorEgypt, Arab Rep.El SalvadorEquatorial GuineaEritreaEstoniaEthiopiaEuro areaFaroe IslandsFijiFinlandFranceFrench PolynesiaGabonGambia, TheGeorgiaGermanyGhanaGreeceGrenadaGuatemalaGuineaGuinea-BissauGuyanaHaitiHondurasHong Kong SAR, ChinaHungaryIcelandIndiaIndonesiaIran, Islamic Rep.IraqIrelandIsraelItalyJamaicaJapanJordanKazakhstanKenyaKiribatiKorea, Rep.KosovoKuwaitKyrgyz RepublicLao PDRLatviaLebanonLesothoLiberiaLibyaLithuaniaLuxembourgMacao SAR, ChinaMacedonia, FYRMadagascarMalawiMalaysiaMaldivesMaliMaltaMarshall IslandsMauritaniaMauritiusMexicoMicronesia, Fed. Sts.MoldovaMongoliaMontenegroMoroccoMozambiqueMyanmarNamibiaNepalNetherlandsNew CaledoniaNew ZealandNicaraguaNigerNigeriaNorwayOmanPakistanPalauPanamaPapua New GuineaParaguayPeruPhilippinesPolandPortugalQatarRomaniaRussian FederationRwandaSamoaSao Tome and PrincipeSaudi ArabiaSenegalSerbiaSeychellesSierra LeoneSingaporeSint Maarten (Dutch part)Slovak RepublicSloveniaSolomon IslandsSouth AfricaSouth SudanSpainSri LankaSt. Kitts and NevisSt. LuciaSt. Vincent and the GrenadinesSudanSurinameSwazilandSwedenSwitzerlandSyrian Arab RepublicTajikistanTanzaniaThailandTimor-LesteTogoTongaTrinidad and TobagoTunisiaTurkeyTuvaluUgandaUkraineUnited KingdomUnited StatesUruguayVanuatuVenezuela, RBVietnamWest Bank and GazaYemen, Rep.ZambiaZimbabwe

línea de tiempo (timeline):

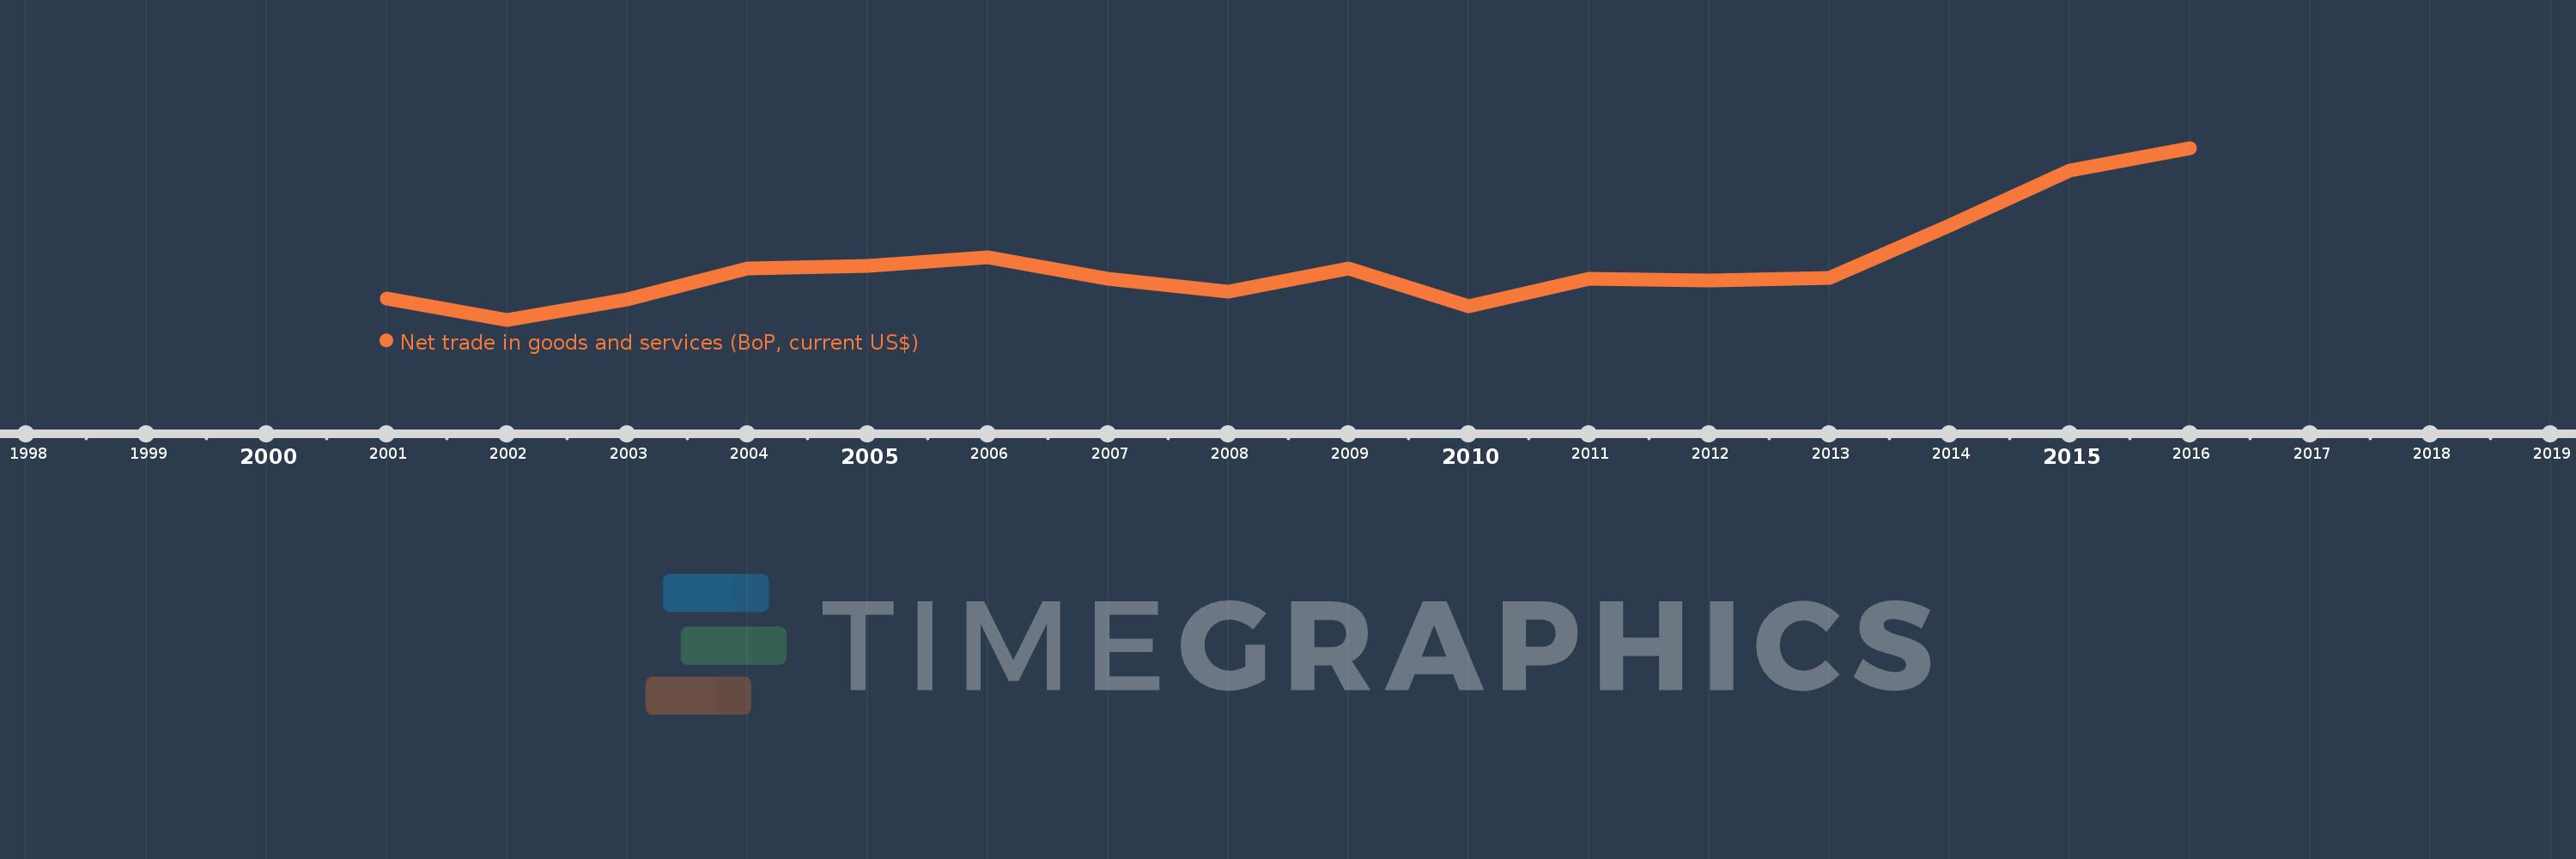
En esta escala de tiempo se presenta un gráfico de 2001 y 2016 de Euro area. Los datos de 2000 están ausentes. El número de observaciones reales por fecha: 16.

Fuente (nombre):

Indicadores del desarrollo mundial

Fuente (organización):

International Monetary Fund, Balance of Payments Statistics Yearbook and data files.

Categorías:

Economy & Growth, Trade

Se ha actualizado:

23 abr 2017 año

Los indicadores de los cambios de valor en los últimos años

En promedio:
141.823 bn
Mínimo:
7.213 bn
1 ene 2002 año
Máximo:
427.423 bn
1 ene 2016 año
A la fecha de observación
Valor
Cambio absoluto
El cambio con respecto al valor anterior
1 ene 2001 año
60.002 bn
+60.002 bn
0.0%
1 ene 2002 año
7.213 bn
-52.79 bn
-87.98%
1 ene 2003 año
57.821 bn
+50.608 bn
701.64%
1 ene 2004 año
131.989 bn
+74.169 bn
128.27%
1 ene 2005 año
138.004 bn
+6.015 bn
4.56%
1 ene 2006 año
159.62 bn
+21.616 bn
15.66%
1 ene 2007 año
106.441 bn
-53.179 bn
-33.32%
1 ene 2008 año
75.332 bn
-31.109 bn
-29.23%
1 ene 2009 año
133.687 bn
+58.355 bn
77.46%
1 ene 2010 año
41.217 bn
-92.469 bn
-69.17%
1 ene 2011 año
108.103 bn
+66.886 bn
162.28%
1 ene 2012 año
102.809 bn
-5.294 bn
-4.9%
1 ene 2013 año
110.376 bn
+7.567 bn
7.36%
1 ene 2014 año
237.231 bn
+126.855 bn
114.93%
1 ene 2015 año
371.899 bn
+134.668 bn
56.77%
1 ene 2016 año
427.423 bn
+55.524 bn
14.93%

Ranking de los países por los datos estadísticos actuales