29
/es/
es
AIzaSyAYiBZKx7MnpbEhh9jyipgxe19OcubqV5w
April 1, 2024
125223
Egypt, Arab Rep.
EGY
true
2
1
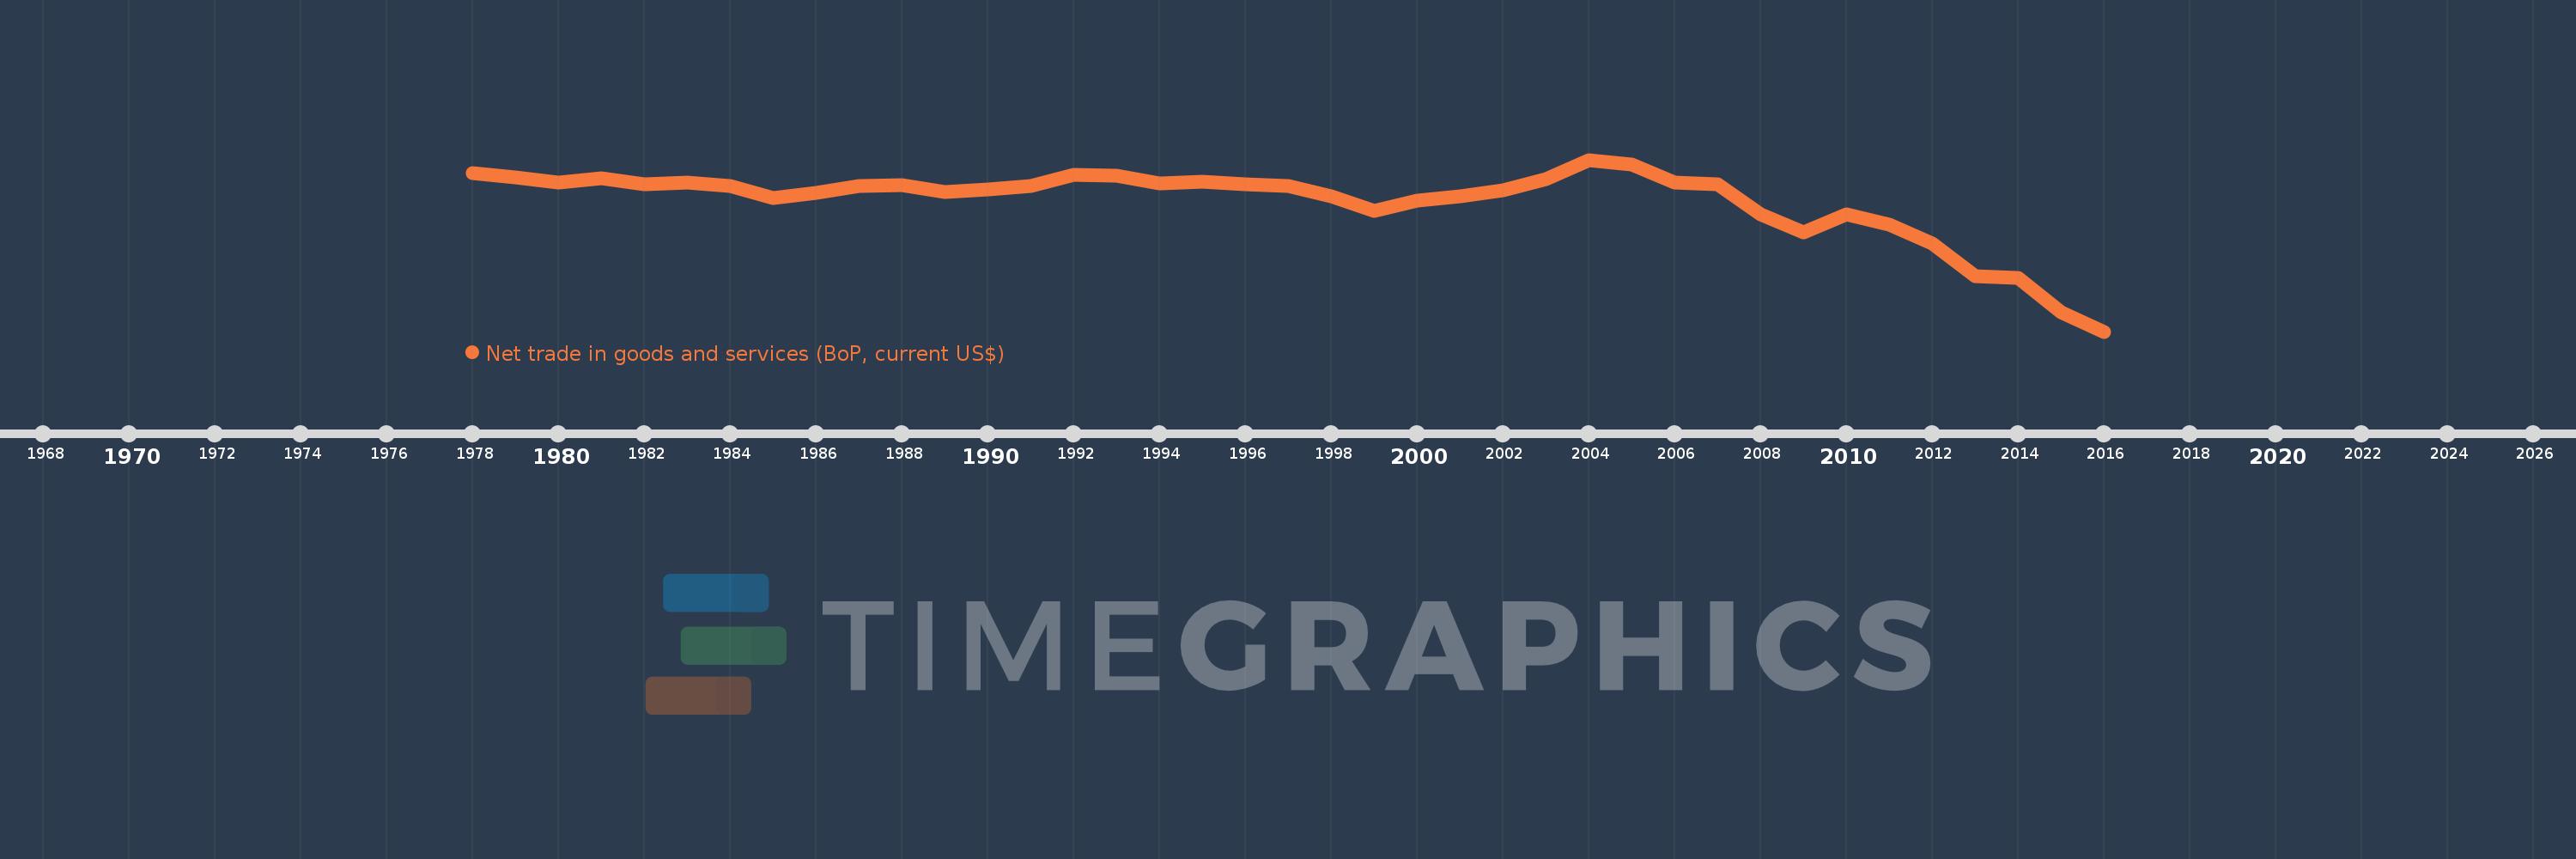
Net trade in goods and services (BoP, current US$)
2016,2015,2014,2013,2012,2011,2010,2009,2008,2007,2006,2005,2004,2003,2002,2001,2000,1999,1998,1997,1996,1995,1994,1993,1992,1991,1990,1989,1988,1987,1986,1985,1984,1983,1982,1981,1980,1979,1978
Estas estadísticas en otros países:
AfghanistanAlbaniaAlgeriaAngolaAntigua and BarbudaArgentinaArmeniaArubaAustraliaAustriaAzerbaijanBahamas, TheBahrainBangladeshBarbadosBelarusBelgiumBelizeBeninBermudaBhutanBoliviaBosnia and HerzegovinaBotswanaBrazilBrunei DarussalamBulgariaBurkina FasoBurundiCabo VerdeCambodiaCameroonCanadaCentral African RepublicChadChileChinaColombiaComorosCongo, Dem. Rep.Congo, Rep.Costa RicaCote d'IvoireCroatiaCuracaoCyprusCzech RepublicDenmarkDjiboutiDominicaDominican RepublicEcuadorEgypt, Arab Rep.El SalvadorEquatorial GuineaEritreaEstoniaEthiopiaEuro areaFaroe IslandsFijiFinlandFranceFrench PolynesiaGabonGambia, TheGeorgiaGermanyGhanaGreeceGrenadaGuatemalaGuineaGuinea-BissauGuyanaHaitiHondurasHong Kong SAR, ChinaHungaryIcelandIndiaIndonesiaIran, Islamic Rep.IraqIrelandIsraelItalyJamaicaJapanJordanKazakhstanKenyaKiribatiKorea, Rep.KosovoKuwaitKyrgyz RepublicLao PDRLatviaLebanonLesothoLiberiaLibyaLithuaniaLuxembourgMacao SAR, ChinaMacedonia, FYRMadagascarMalawiMalaysiaMaldivesMaliMaltaMarshall IslandsMauritaniaMauritiusMexicoMicronesia, Fed. Sts.MoldovaMongoliaMontenegroMoroccoMozambiqueMyanmarNamibiaNepalNetherlandsNew CaledoniaNew ZealandNicaraguaNigerNigeriaNorwayOmanPakistanPalauPanamaPapua New GuineaParaguayPeruPhilippinesPolandPortugalQatarRomaniaRussian FederationRwandaSamoaSao Tome and PrincipeSaudi ArabiaSenegalSerbiaSeychellesSierra LeoneSingaporeSint Maarten (Dutch part)Slovak RepublicSloveniaSolomon IslandsSouth AfricaSouth SudanSpainSri LankaSt. Kitts and NevisSt. LuciaSt. Vincent and the GrenadinesSudanSurinameSwazilandSwedenSwitzerlandSyrian Arab RepublicTajikistanTanzaniaThailandTimor-LesteTogoTongaTrinidad and TobagoTunisiaTurkeyTuvaluUgandaUkraineUnited KingdomUnited StatesUruguayVanuatuVenezuela, RBVietnamWest Bank and GazaYemen, Rep.ZambiaZimbabwe línea de tiempo (timeline):
En esta escala de tiempo se presenta un gráfico de 1978 y 2016 de Egypt, Arab Rep.. Los datos de 1977 están ausentes. El número de observaciones reales por fecha: 39.
Fuente (nombre):
Indicadores del desarrollo mundial
Fuente (organización):
International Monetary Fund, Balance of Payments Statistics Yearbook and data files.
Categorías:
Economy & Growth, Trade
Se ha actualizado:
23 abr 2017 año
Los indicadores de los cambios de valor en los últimos años
Mínimo:
-29.954 bn
1 ene 2016 año
Máximo:
397.9 millones
1 ene 2004 año
A la fecha de observación
Valor
Cambio absoluto
El cambio con respecto al valor anterior
1 ene 1978 año
-1.912 bn
-1.912 bn
0.0%
1 ene 1979 año
-2.719 bn
-807.299 millones
42.23%
1 ene 1980 año
-3.563 bn
-844.292 millones
31.05%
1 ene 1981 año
-2.911 bn
+652.286 millones
-18.31%
1 ene 1982 año
-3.869 bn
-958.571 millones
32.93%
1 ene 1983 año
-3.642 bn
+227.429 millones
-5.88%
1 ene 1984 año
-4.192 bn
-550.286 millones
15.11%
1 ene 1985 año
-6.323 bn
-2.13 bn
50.81%
1 ene 1986 año
-5.381 bn
+941.286 millones
-14.89%
1 ene 1987 año
-4.192 bn
+1.189 bn
-22.1%
1 ene 1988 año
-4.095 bn
+97.286 millones
-2.32%
1 ene 1989 año
-5.283 bn
-1.188 bn
29.02%
1 ene 1990 año
-4.802 bn
+481.039 millones
-9.11%
1 ene 1991 año
-4.196 bn
+606.318 millones
-12.63%
1 ene 1992 año
-2.248 bn
+1.948 bn
-46.42%
1 ene 1993 año
-2.382 bn
-134.0 millones
5.96%
1 ene 1994 año
-3.85 bn
-1.468 bn
61.63%
1 ene 1995 año
-3.528 bn
+322.0 millones
-8.36%
1 ene 1996 año
-3.88 bn
-352.0 millones
9.98%
1 ene 1997 año
-4.203 bn
-323.0 millones
8.32%
1 ene 1998 año
-6.021 bn
-1.818 bn
43.26%
1 ene 1999 año
-8.565 bn
-2.544 bn
42.24%
1 ene 2000 año
-6.886 bn
+1.679 bn
-19.6%
1 ene 2001 año
-6.031 bn
+855.1 millones
-12.42%
1 ene 2002 año
-4.929 bn
+1.102 bn
-18.27%
1 ene 2003 año
-3.071 bn
+1.858 bn
-37.7%
1 ene 2004 año
397.9 millones
+3.468 bn
-112.96%
1 ene 2005 año
-399.1 millones
-797.0 millones
-200.3%
1 ene 2006 año
-3.611 bn
-3.211 bn
804.66%
1 ene 2007 año
-3.873 bn
-262.1 millones
7.26%
1 ene 2008 año
-9.299 bn
-5.426 bn
140.12%
1 ene 2009 año
-12.462 bn
-3.163 bn
34.02%
1 ene 2010 año
-9.233 bn
+3.229 bn
-25.91%
1 ene 2011 año
-11.031 bn
-1.798 bn
19.47%
1 ene 2012 año
-14.328 bn
-3.297 bn
29.89%
1 ene 2013 año
-20.2 bn
-5.871 bn
40.98%
1 ene 2014 año
-20.531 bn
-331.1 millones
1.64%
1 ene 2015 año
-26.574 bn
-6.043 bn
29.43%
1 ene 2016 año
-29.954 bn
-3.38 bn
12.72%
Ranking de los países por los datos estadísticos actuales


Comentarios: