29
/es/
es
AIzaSyAYiBZKx7MnpbEhh9jyipgxe19OcubqV5w
April 1, 2024
142138
Greece
GRC
true
2
1
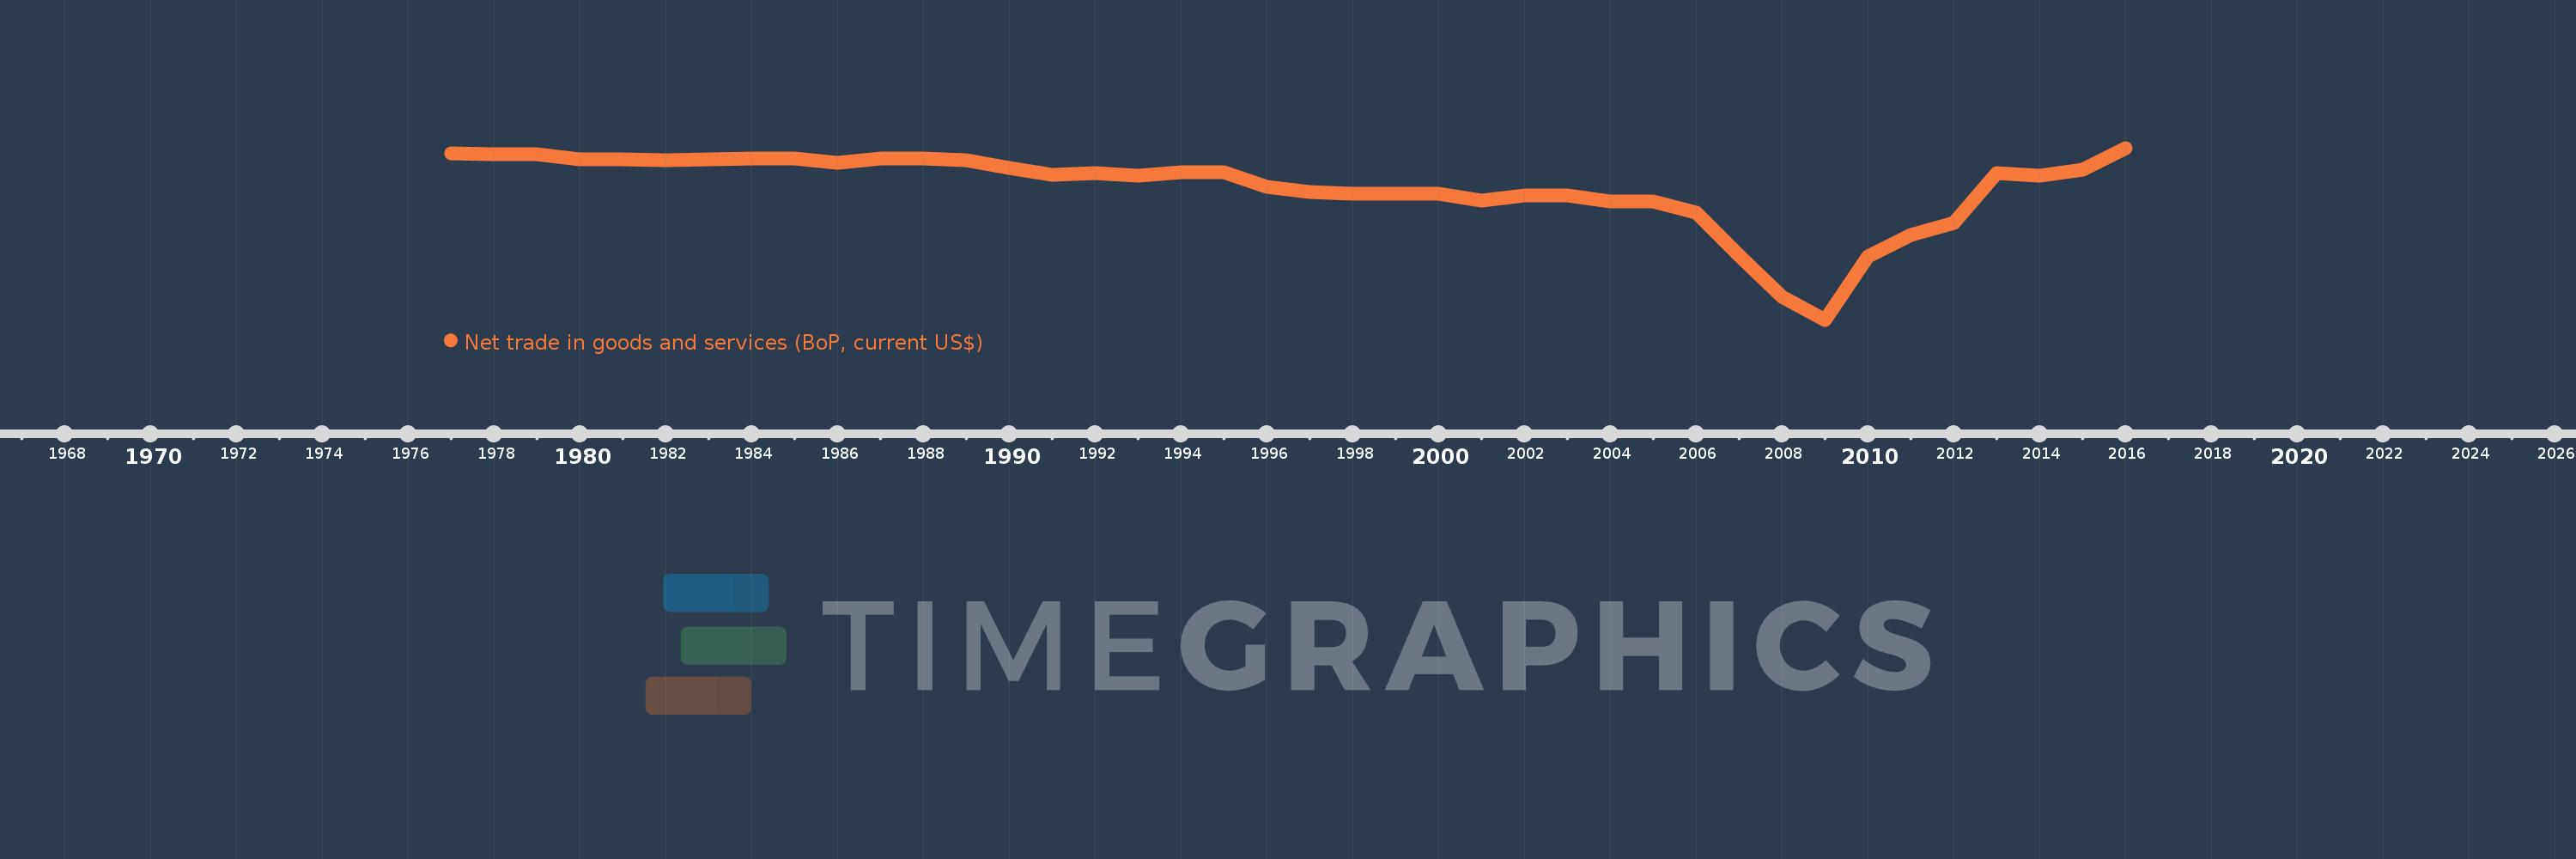
Net trade in goods and services (BoP, current US$)
2016,2015,2014,2013,2012,2011,2010,2009,2008,2007,2006,2005,2004,2003,2002,2001,2000,1998,1997,1996,1995,1994,1993,1992,1991,1990,1989,1988,1987,1986,1985,1984,1983,1982,1981,1980,1979,1978,1977
Estas estadísticas en otros países:
AfghanistanAlbaniaAlgeriaAngolaAntigua and BarbudaArgentinaArmeniaArubaAustraliaAustriaAzerbaijanBahamas, TheBahrainBangladeshBarbadosBelarusBelgiumBelizeBeninBermudaBhutanBoliviaBosnia and HerzegovinaBotswanaBrazilBrunei DarussalamBulgariaBurkina FasoBurundiCabo VerdeCambodiaCameroonCanadaCentral African RepublicChadChileChinaColombiaComorosCongo, Dem. Rep.Congo, Rep.Costa RicaCote d'IvoireCroatiaCuracaoCyprusCzech RepublicDenmarkDjiboutiDominicaDominican RepublicEcuadorEgypt, Arab Rep.El SalvadorEquatorial GuineaEritreaEstoniaEthiopiaEuro areaFaroe IslandsFijiFinlandFranceFrench PolynesiaGabonGambia, TheGeorgiaGermanyGhanaGreeceGrenadaGuatemalaGuineaGuinea-BissauGuyanaHaitiHondurasHong Kong SAR, ChinaHungaryIcelandIndiaIndonesiaIran, Islamic Rep.IraqIrelandIsraelItalyJamaicaJapanJordanKazakhstanKenyaKiribatiKorea, Rep.KosovoKuwaitKyrgyz RepublicLao PDRLatviaLebanonLesothoLiberiaLibyaLithuaniaLuxembourgMacao SAR, ChinaMacedonia, FYRMadagascarMalawiMalaysiaMaldivesMaliMaltaMarshall IslandsMauritaniaMauritiusMexicoMicronesia, Fed. Sts.MoldovaMongoliaMontenegroMoroccoMozambiqueMyanmarNamibiaNepalNetherlandsNew CaledoniaNew ZealandNicaraguaNigerNigeriaNorwayOmanPakistanPalauPanamaPapua New GuineaParaguayPeruPhilippinesPolandPortugalQatarRomaniaRussian FederationRwandaSamoaSao Tome and PrincipeSaudi ArabiaSenegalSerbiaSeychellesSierra LeoneSingaporeSint Maarten (Dutch part)Slovak RepublicSloveniaSolomon IslandsSouth AfricaSouth SudanSpainSri LankaSt. Kitts and NevisSt. LuciaSt. Vincent and the GrenadinesSudanSurinameSwazilandSwedenSwitzerlandSyrian Arab RepublicTajikistanTanzaniaThailandTimor-LesteTogoTongaTrinidad and TobagoTunisiaTurkeyTuvaluUgandaUkraineUnited KingdomUnited StatesUruguayVanuatuVenezuela, RBVietnamWest Bank and GazaYemen, Rep.ZambiaZimbabwe línea de tiempo (timeline):
En esta escala de tiempo se presenta un gráfico de 1977 y 2016 de Greece. Los datos de 1976 están ausentes. El número de observaciones reales por fecha: 39.
Fuente (nombre):
Indicadores del desarrollo mundial
Fuente (organización):
International Monetary Fund, Balance of Payments Statistics Yearbook and data files.
Categorías:
Economy & Growth, Trade
Se ha actualizado:
23 abr 2017 año
Los indicadores de los cambios de valor en los últimos años
Mínimo:
-39.477 bn
1 ene 2009 año
Máximo:
-341.592 millones
1 ene 2016 año
A la fecha de observación
Valor
Cambio absoluto
El cambio con respecto al valor anterior
1 ene 1977 año
-1.608 bn
-1.608 bn
0.0%
1 ene 1978 año
-1.841 bn
-233.0 millones
14.49%
1 ene 1979 año
-1.774 bn
+67.0 millones
-3.64%
1 ene 1980 año
-2.878 bn
-1.104 bn
62.23%
1 ene 1981 año
-3.023 bn
-145.0 millones
5.04%
1 ene 1982 año
-3.104 bn
-81.0 millones
2.68%
1 ene 1983 año
-2.901 bn
+203.0 millones
-6.54%
1 ene 1984 año
-2.824 bn
+77.0 millones
-2.65%
1 ene 1985 año
-2.807 bn
+17.0 millones
-0.6%
1 ene 1986 año
-3.814 bn
-1.007 bn
35.87%
1 ene 1987 año
-2.736 bn
+1.078 bn
-28.26%
1 ene 1988 año
-2.829 bn
-93.0 millones
3.4%
1 ene 1989 año
-3.097 bn
-268.0 millones
9.47%
1 ene 1990 año
-4.914 bn
-1.817 bn
58.67%
1 ene 1991 año
-6.546 bn
-1.632 bn
33.21%
1 ene 1992 año
-5.993 bn
+553.3 millones
-8.45%
1 ene 1993 año
-6.565 bn
-572.3 millones
9.55%
1 ene 1994 año
-5.806 bn
+759.0 millones
-11.56%
1 ene 1995 año
-5.834 bn
-28.0 millones
0.48%
1 ene 1996 año
-9.188 bn
-3.354 bn
57.49%
1 ene 1997 año
-10.395 bn
-1.207 bn
13.14%
1 ene 1998 año
-10.738 bn
-343.0 millones
3.3%
1 ene 2000 año
-10.696 bn
+42.2 millones
-0.39%
1 ene 2001 año
-12.286 bn
-1.591 bn
14.87%
1 ene 2002 año
-11.22 bn
+1.066 bn
-8.68%
1 ene 2003 año
-11.132 bn
+87.818 millones
-0.78%
1 ene 2004 año
-12.573 bn
-1.441 bn
12.94%
1 ene 2005 año
-12.556 bn
+16.991 millones
-0.14%
1 ene 2006 año
-15.096 bn
-2.54 bn
20.23%
1 ene 2007 año
-24.889 bn
-9.793 bn
64.87%
1 ene 2008 año
-34.24 bn
-9.351 bn
37.57%
1 ene 2009 año
-39.477 bn
-5.237 bn
15.3%
1 ene 2010 año
-25.054 bn
+14.423 bn
-36.53%
1 ene 2011 año
-20.26 bn
+4.794 bn
-19.14%
1 ene 2012 año
-17.339 bn
+2.921 bn
-14.42%
1 ene 2013 año
-5.996 bn
+11.343 bn
-65.42%
1 ene 2014 año
-6.742 bn
-745.53 millones
12.43%
1 ene 2015 año
-5.248 bn
+1.494 bn
-22.16%
1 ene 2016 año
-341.592 millones
+4.906 bn
-93.49%
Ranking de los países por los datos estadísticos actuales


Comentarios: