29
/es/
es
AIzaSyAYiBZKx7MnpbEhh9jyipgxe19OcubqV5w
April 1, 2024
287331
Zimbabwe
ZWE
true
2
1
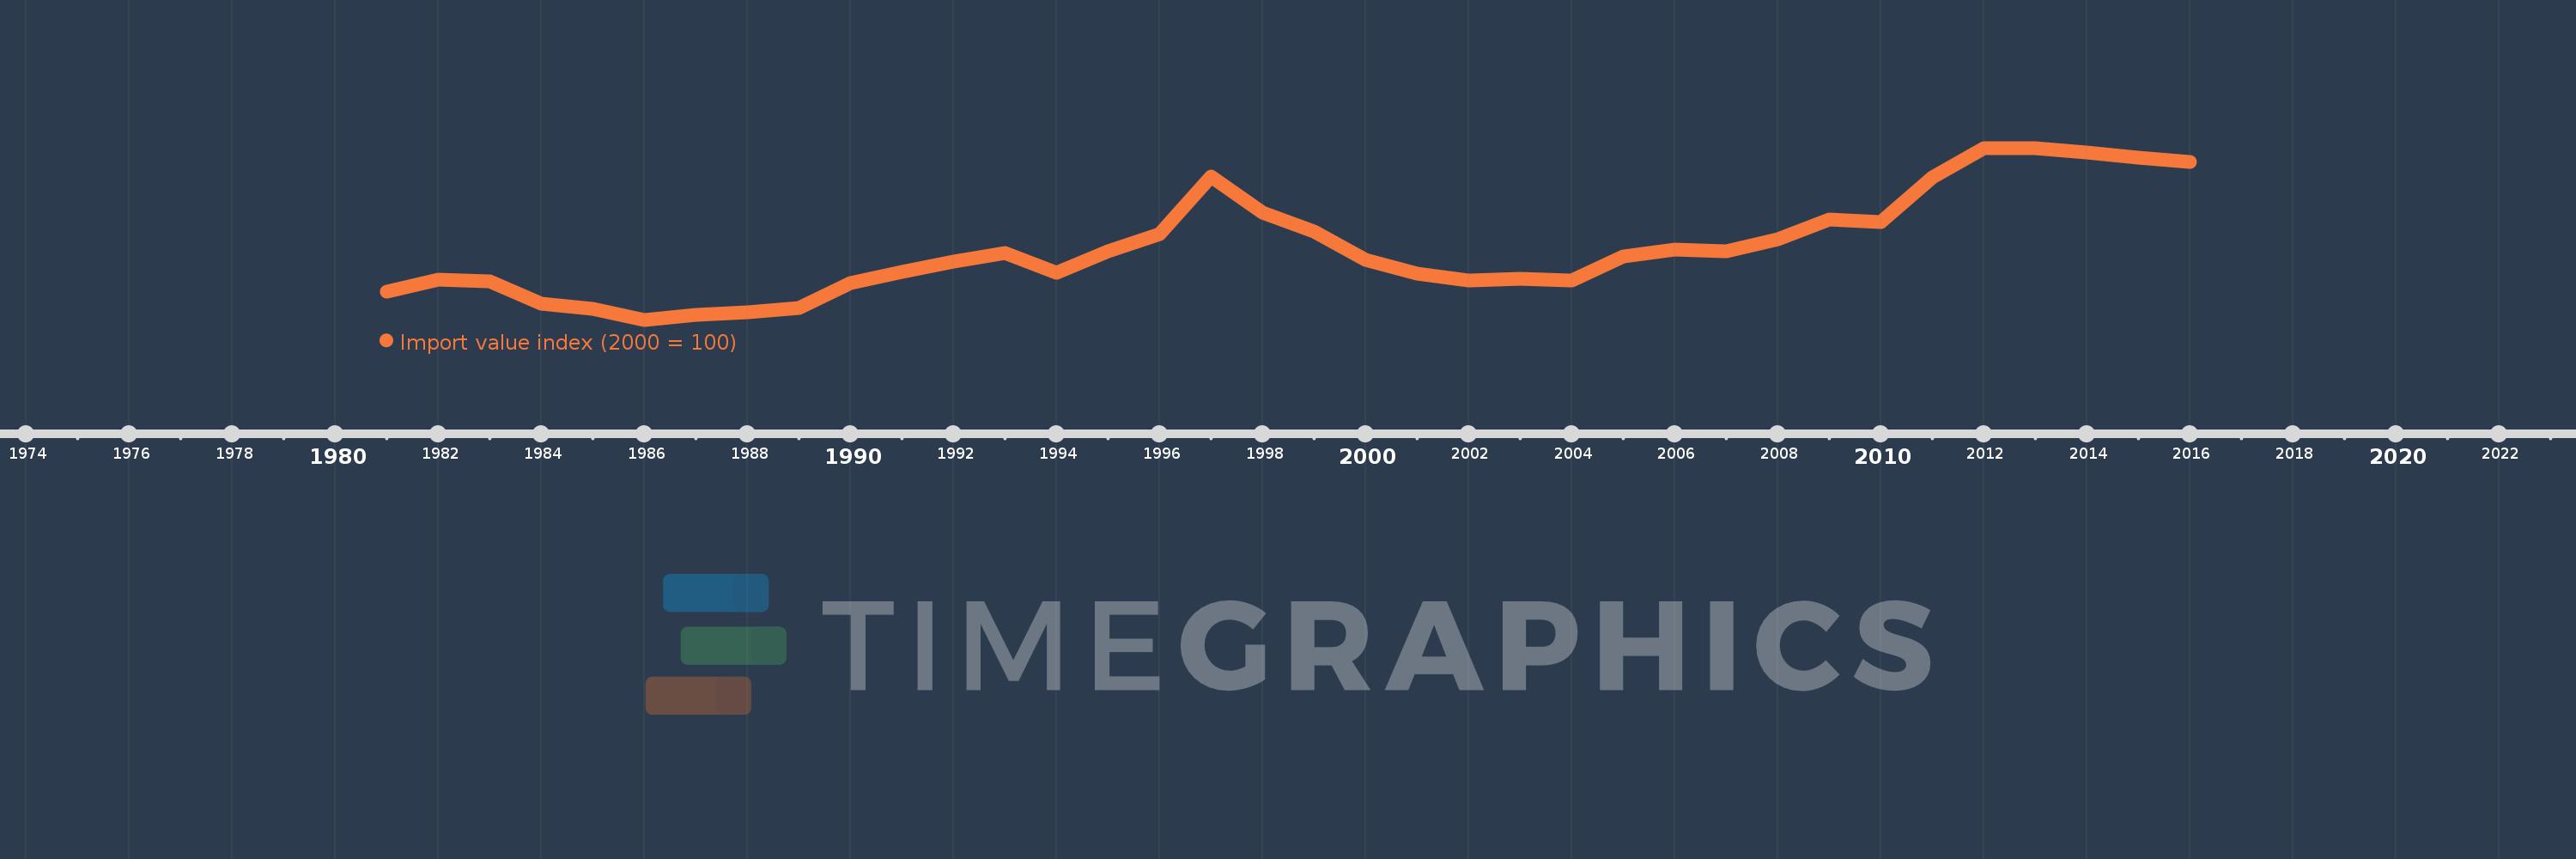
Import value index (2000 = 100)
2016,2015,2014,2013,2012,2011,2010,2009,2008,2007,2006,2005,2004,2003,2002,2001,2000,1999,1998,1997,1996,1995,1994,1993,1992,1991,1990,1989,1988,1987,1986,1985,1984,1983,1982,1981
Estas estadísticas en otros países:
AfghanistanAlbaniaAlgeriaAmerican SamoaAndorraAngolaAntigua and BarbudaArgentinaArmeniaArubaAustraliaAustriaAzerbaijanBahamas, TheBahrainBangladeshBarbadosBelarusBelgiumBelizeBeninBermudaBhutanBoliviaBosnia and HerzegovinaBotswanaBrazilBritish Virgin IslandsBrunei DarussalamBulgariaBurkina FasoBurundiCabo VerdeCambodiaCameroonCanadaCayman IslandsCentral African RepublicChadChileChinaColombiaComorosCongo, Dem. Rep.Congo, Rep.Costa RicaCote d'IvoireCroatiaCubaCuracaoCyprusCzech RepublicDenmarkDjiboutiDominicaDominican RepublicEcuadorEgypt, Arab Rep.El SalvadorEquatorial GuineaEritreaEstoniaEthiopiaFaroe IslandsFijiFinlandFranceFrench PolynesiaGabonGambia, TheGeorgiaGermanyGhanaGibraltarGreeceGreenlandGrenadaGuamGuatemalaGuineaGuinea-BissauGuyanaHaitiHondurasHong Kong SAR, ChinaHungaryIcelandIndiaIndonesiaIran, Islamic Rep.IraqIrelandIsraelItalyJamaicaJapanJordanKazakhstanKenyaKiribatiKorea, Dem. People’s Rep.Korea, Rep.KuwaitKyrgyz RepublicLao PDRLatviaLebanonLesothoLiberiaLibyaLithuaniaLuxembourgMacao SAR, ChinaMacedonia, FYRMadagascarMalawiMalaysiaMaldivesMaliMaltaMarshall IslandsMauritaniaMauritiusMexicoMicronesia, Fed. Sts.MoldovaMongoliaMoroccoMozambiqueMyanmarNamibiaNauruNepalNetherlandsNew CaledoniaNew ZealandNicaraguaNigerNigeriaNorthern Mariana IslandsNorwayOmanPakistanPalauPanamaPapua New GuineaParaguayPeruPhilippinesPolandPortugalQatarRomaniaRussian FederationRwandaSamoaSao Tome and PrincipeSaudi ArabiaSenegalSerbiaSeychellesSierra LeoneSingaporeSlovak RepublicSloveniaSolomon IslandsSomaliaSouth AfricaSpainSri LankaSt. Kitts and NevisSt. LuciaSt. Vincent and the GrenadinesSudanSurinameSwazilandSwedenSwitzerlandSyrian Arab RepublicTajikistanTanzaniaThailandTogoTongaTrinidad and TobagoTunisiaTurkeyTurkmenistanTurks and Caicos IslandsUgandaUkraineUnited Arab EmiratesUnited KingdomUnited StatesUruguayUzbekistanVanuatuVenezuela, RBVietnamWest Bank and GazaYemen, Rep.ZambiaZimbabwe línea de tiempo (timeline):
En esta escala de tiempo se presenta un gráfico de 1981 y 2016 de Zimbabwe. Los datos de 1980 están ausentes. El número de observaciones reales por fecha: 36.
Fuente (nombre):
Indicadores del desarrollo mundial
Fuente (organización):
United Nations Conference on Trade and Development, Handbook of Statistics and data files, and International Monetary Fund, International Financial Statistics.
Categorías:
Private Sector, Trade
Se ha actualizado:
23 abr 2017 año
Los indicadores de los cambios de valor en los últimos años
Mínimo:
49.507
1 ene 1986 año
Máximo:
236.178
1 ene 2012 año
A la fecha de observación
Valor
Cambio absoluto
El cambio con respecto al valor anterior
1 ene 1981 año
80.053
+80.053
0.0%
1 ene 1982 año
93.535
+13.482
16.84%
1 ene 1983 año
90.843
-2.693
-2.88%
1 ene 1984 año
66.812
-24.031
-26.45%
1 ene 1985 año
60.955
-5.857
-8.77%
1 ene 1986 año
49.507
-11.448
-18.78%
1 ene 1987 año
54.425
+4.919
9.94%
1 ene 1988 año
57.861
+3.436
6.31%
1 ene 1989 año
62.512
+4.651
8.04%
1 ene 1990 año
89.192
+26.68
42.68%
1 ene 1991 año
101.613
+12.421
13.93%
1 ene 1992 año
112.516
+10.904
10.73%
1 ene 1993 año
121.618
+9.102
8.09%
1 ene 1994 año
100.403
-21.215
-17.44%
1 ene 1995 año
123.816
+23.413
23.32%
1 ene 1996 año
142.31
+18.494
14.94%
1 ene 1997 año
204.765
+62.455
43.89%
1 ene 1998 año
165.969
-38.796
-18.95%
1 ene 1999 año
144.981
-20.988
-12.65%
1 ene 2000 año
114.117
-30.864
-21.29%
1 ene 2001 año
100.0
-14.117
-12.37%
1 ene 2002 año
92.056
-7.944
-7.94%
1 ene 2003 año
93.988
+1.932
2.1%
1 ene 2004 año
91.787
-2.201
-2.34%
1 ene 2005 año
118.292
+26.504
28.88%
1 ene 2006 año
126.141
+7.849
6.64%
1 ene 2007 año
123.457
-2.684
-2.13%
1 ene 2008 año
136.876
+13.419
10.87%
1 ene 2009 año
158.347
+21.471
15.69%
1 ene 2010 año
155.663
-2.684
-1.69%
1 ene 2011 año
203.972
+48.309
31.03%
1 ene 2012 año
236.178
+32.206
15.79%
1 ene 2013 año
236.178
0.0
0.0%
1 ene 2014 año
230.811
-5.368
-2.27%
1 ene 2015 año
225.443
-5.368
-2.33%
1 ene 2016 año
220.912
-4.531
-2.01%
Ranking de los países por los datos estadísticos actuales


Comentarios: