29
/es/
es
AIzaSyAYiBZKx7MnpbEhh9jyipgxe19OcubqV5w
April 1, 2024
238372
Seychelles
SYC
true
2
1
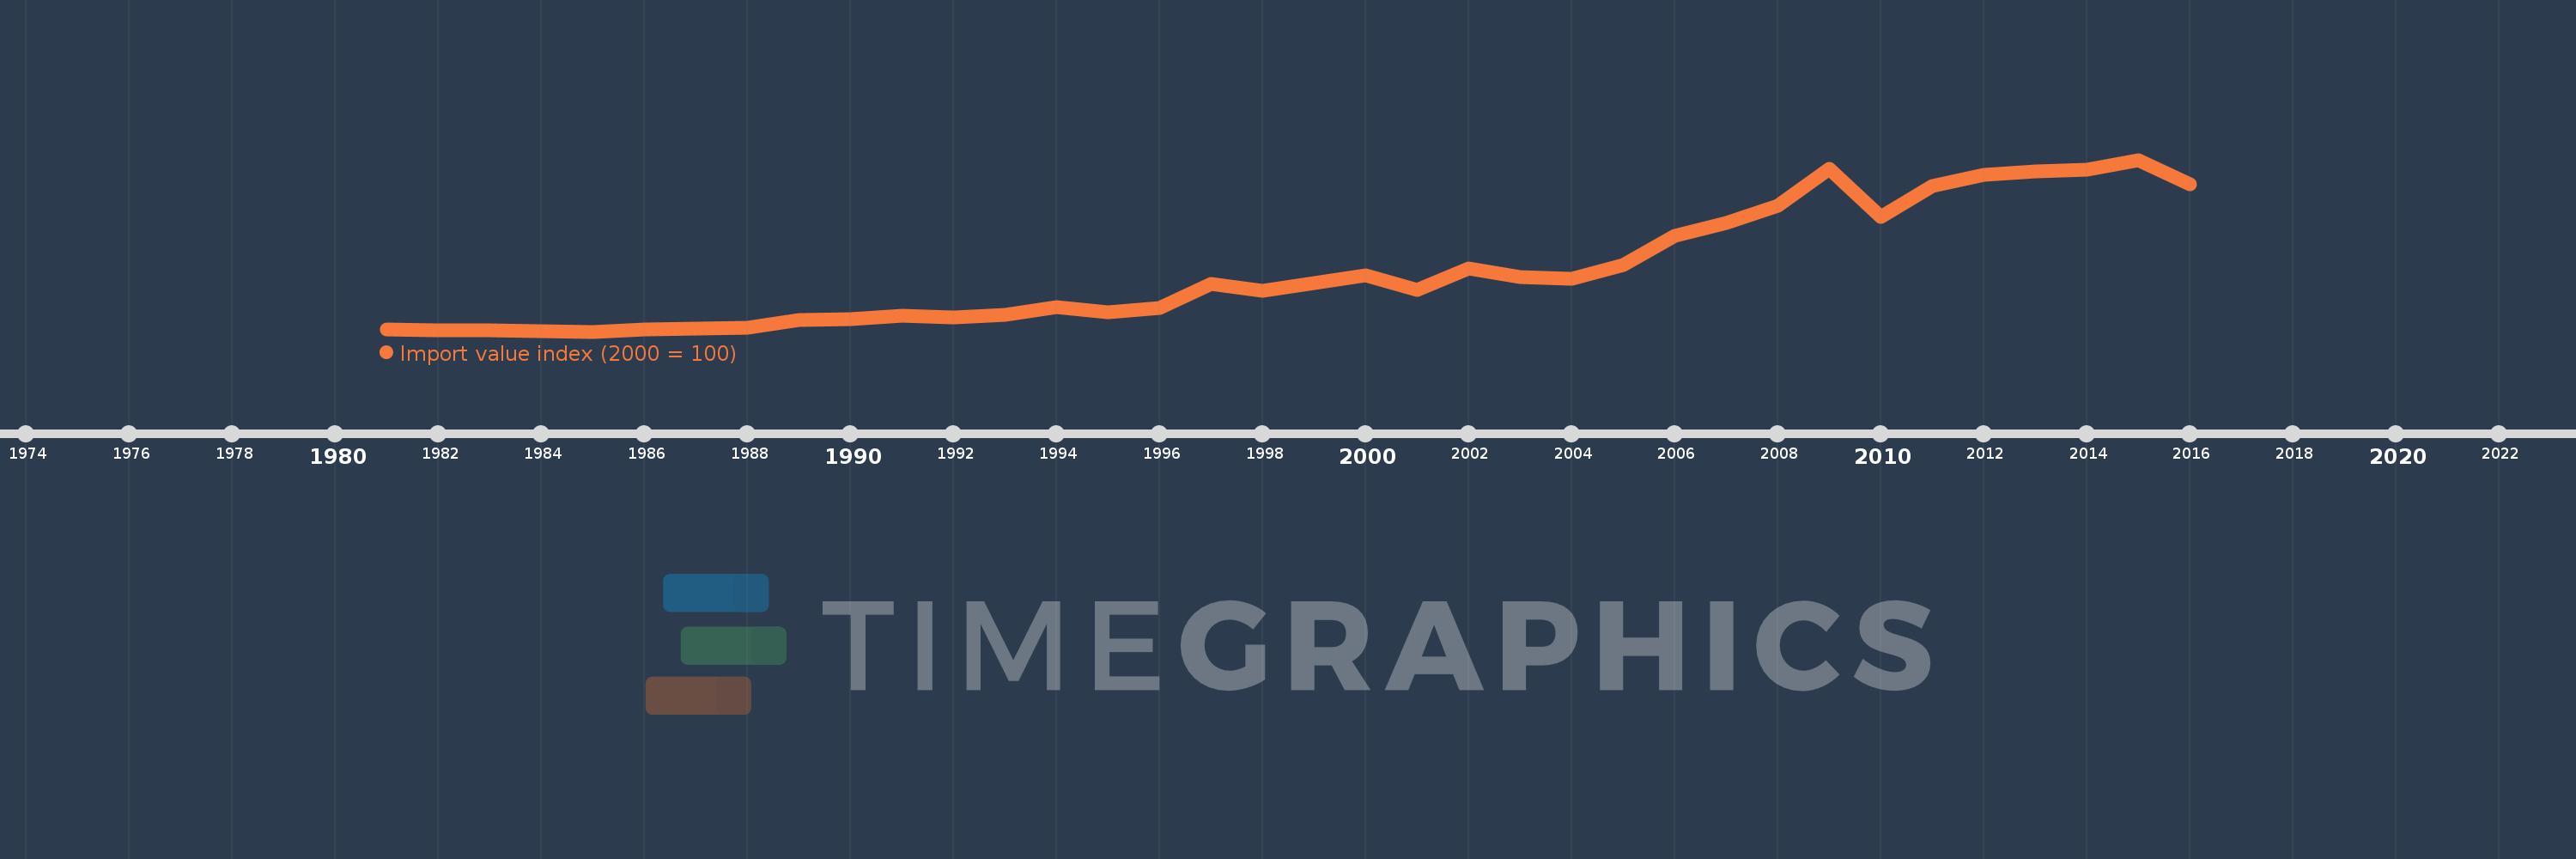
Import value index (2000 = 100)
2016,2015,2014,2013,2012,2011,2010,2009,2008,2007,2006,2005,2004,2003,2002,2001,2000,1999,1998,1997,1996,1995,1994,1993,1992,1991,1990,1989,1988,1987,1986,1985,1984,1983,1982,1981
Estas estadísticas en otros países:
AfghanistanAlbaniaAlgeriaAmerican SamoaAndorraAngolaAntigua and BarbudaArgentinaArmeniaArubaAustraliaAustriaAzerbaijanBahamas, TheBahrainBangladeshBarbadosBelarusBelgiumBelizeBeninBermudaBhutanBoliviaBosnia and HerzegovinaBotswanaBrazilBritish Virgin IslandsBrunei DarussalamBulgariaBurkina FasoBurundiCabo VerdeCambodiaCameroonCanadaCayman IslandsCentral African RepublicChadChileChinaColombiaComorosCongo, Dem. Rep.Congo, Rep.Costa RicaCote d'IvoireCroatiaCubaCuracaoCyprusCzech RepublicDenmarkDjiboutiDominicaDominican RepublicEcuadorEgypt, Arab Rep.El SalvadorEquatorial GuineaEritreaEstoniaEthiopiaFaroe IslandsFijiFinlandFranceFrench PolynesiaGabonGambia, TheGeorgiaGermanyGhanaGibraltarGreeceGreenlandGrenadaGuamGuatemalaGuineaGuinea-BissauGuyanaHaitiHondurasHong Kong SAR, ChinaHungaryIcelandIndiaIndonesiaIran, Islamic Rep.IraqIrelandIsraelItalyJamaicaJapanJordanKazakhstanKenyaKiribatiKorea, Dem. People’s Rep.Korea, Rep.KuwaitKyrgyz RepublicLao PDRLatviaLebanonLesothoLiberiaLibyaLithuaniaLuxembourgMacao SAR, ChinaMacedonia, FYRMadagascarMalawiMalaysiaMaldivesMaliMaltaMarshall IslandsMauritaniaMauritiusMexicoMicronesia, Fed. Sts.MoldovaMongoliaMoroccoMozambiqueMyanmarNamibiaNauruNepalNetherlandsNew CaledoniaNew ZealandNicaraguaNigerNigeriaNorthern Mariana IslandsNorwayOmanPakistanPalauPanamaPapua New GuineaParaguayPeruPhilippinesPolandPortugalQatarRomaniaRussian FederationRwandaSamoaSao Tome and PrincipeSaudi ArabiaSenegalSerbiaSeychellesSierra LeoneSingaporeSlovak RepublicSloveniaSolomon IslandsSomaliaSouth AfricaSpainSri LankaSt. Kitts and NevisSt. LuciaSt. Vincent and the GrenadinesSudanSurinameSwazilandSwedenSwitzerlandSyrian Arab RepublicTajikistanTanzaniaThailandTogoTongaTrinidad and TobagoTunisiaTurkeyTurkmenistanTurks and Caicos IslandsUgandaUkraineUnited Arab EmiratesUnited KingdomUnited StatesUruguayUzbekistanVanuatuVenezuela, RBVietnamWest Bank and GazaYemen, Rep.ZambiaZimbabwe línea de tiempo (timeline):
En esta escala de tiempo se presenta un gráfico de 1981 y 2016 de Seychelles. Los datos de 1980 están ausentes. El número de observaciones reales por fecha: 36.
Fuente (nombre):
Indicadores del desarrollo mundial
Fuente (organización):
United Nations Conference on Trade and Development, Handbook of Statistics and data files, and International Monetary Fund, International Financial Statistics.
Categorías:
Private Sector, Trade
Se ha actualizado:
23 abr 2017 año
Los indicadores de los cambios de valor en los últimos años
Mínimo:
25.609
1 ene 1985 año
Máximo:
334.298
1 ene 2015 año
A la fecha de observación
Valor
Cambio absoluto
El cambio con respecto al valor anterior
1 ene 1981 año
28.878
+28.878
0.0%
1 ene 1982 año
27.315
-1.563
-5.41%
1 ene 1983 año
28.652
+1.336
4.89%
1 ene 1984 año
25.72
-2.931
-10.23%
1 ene 1985 año
25.609
-0.111
-0.43%
1 ene 1986 año
29.032
+3.422
13.36%
1 ene 1987 año
30.839
+1.807
6.23%
1 ene 1988 año
33.224
+2.385
7.73%
1 ene 1989 año
46.488
+13.264
39.92%
1 ene 1990 año
48.131
+1.643
3.53%
1 ene 1991 año
54.629
+6.498
13.5%
1 ene 1992 año
50.43
-4.199
-7.69%
1 ene 1993 año
55.955
+5.525
10.96%
1 ene 1994 año
69.685
+13.73
24.54%
1 ene 1995 año
60.382
-9.303
-13.35%
1 ene 1996 año
68.066
+7.684
12.73%
1 ene 1997 año
110.711
+42.645
62.65%
1 ene 1998 año
99.512
-11.199
-10.12%
1 ene 1999 año
112.369
+12.857
12.92%
1 ene 2000 año
126.932
+14.563
12.96%
1 ene 2001 año
100.0
-26.932
-21.22%
1 ene 2002 año
139.181
+39.181
39.18%
1 ene 2003 año
122.934
-16.247
-11.67%
1 ene 2004 año
120.567
-2.367
-1.93%
1 ene 2005 año
145.215
+24.648
20.44%
1 ene 2006 año
197.338
+52.123
35.89%
1 ene 2007 año
221.474
+24.136
12.23%
1 ene 2008 año
251.22
+29.746
13.43%
1 ene 2009 año
317.703
+66.483
26.46%
1 ene 2010 año
232.165
-85.538
-26.92%
1 ene 2011 año
287.807
+55.642
23.97%
1 ene 2012 año
306.784
+18.977
6.59%
1 ene 2013 año
313.012
+6.228
2.03%
1 ene 2014 año
316.667
+3.655
1.17%
1 ene 2015 año
334.298
+17.632
5.57%
1 ene 2016 año
289.848
-44.45
-13.3%
Ranking de los países por los datos estadísticos actuales


Comentarios: