29
/es/
es
AIzaSyAYiBZKx7MnpbEhh9jyipgxe19OcubqV5w
April 1, 2024
203045
Mozambique
MOZ
true
2
1
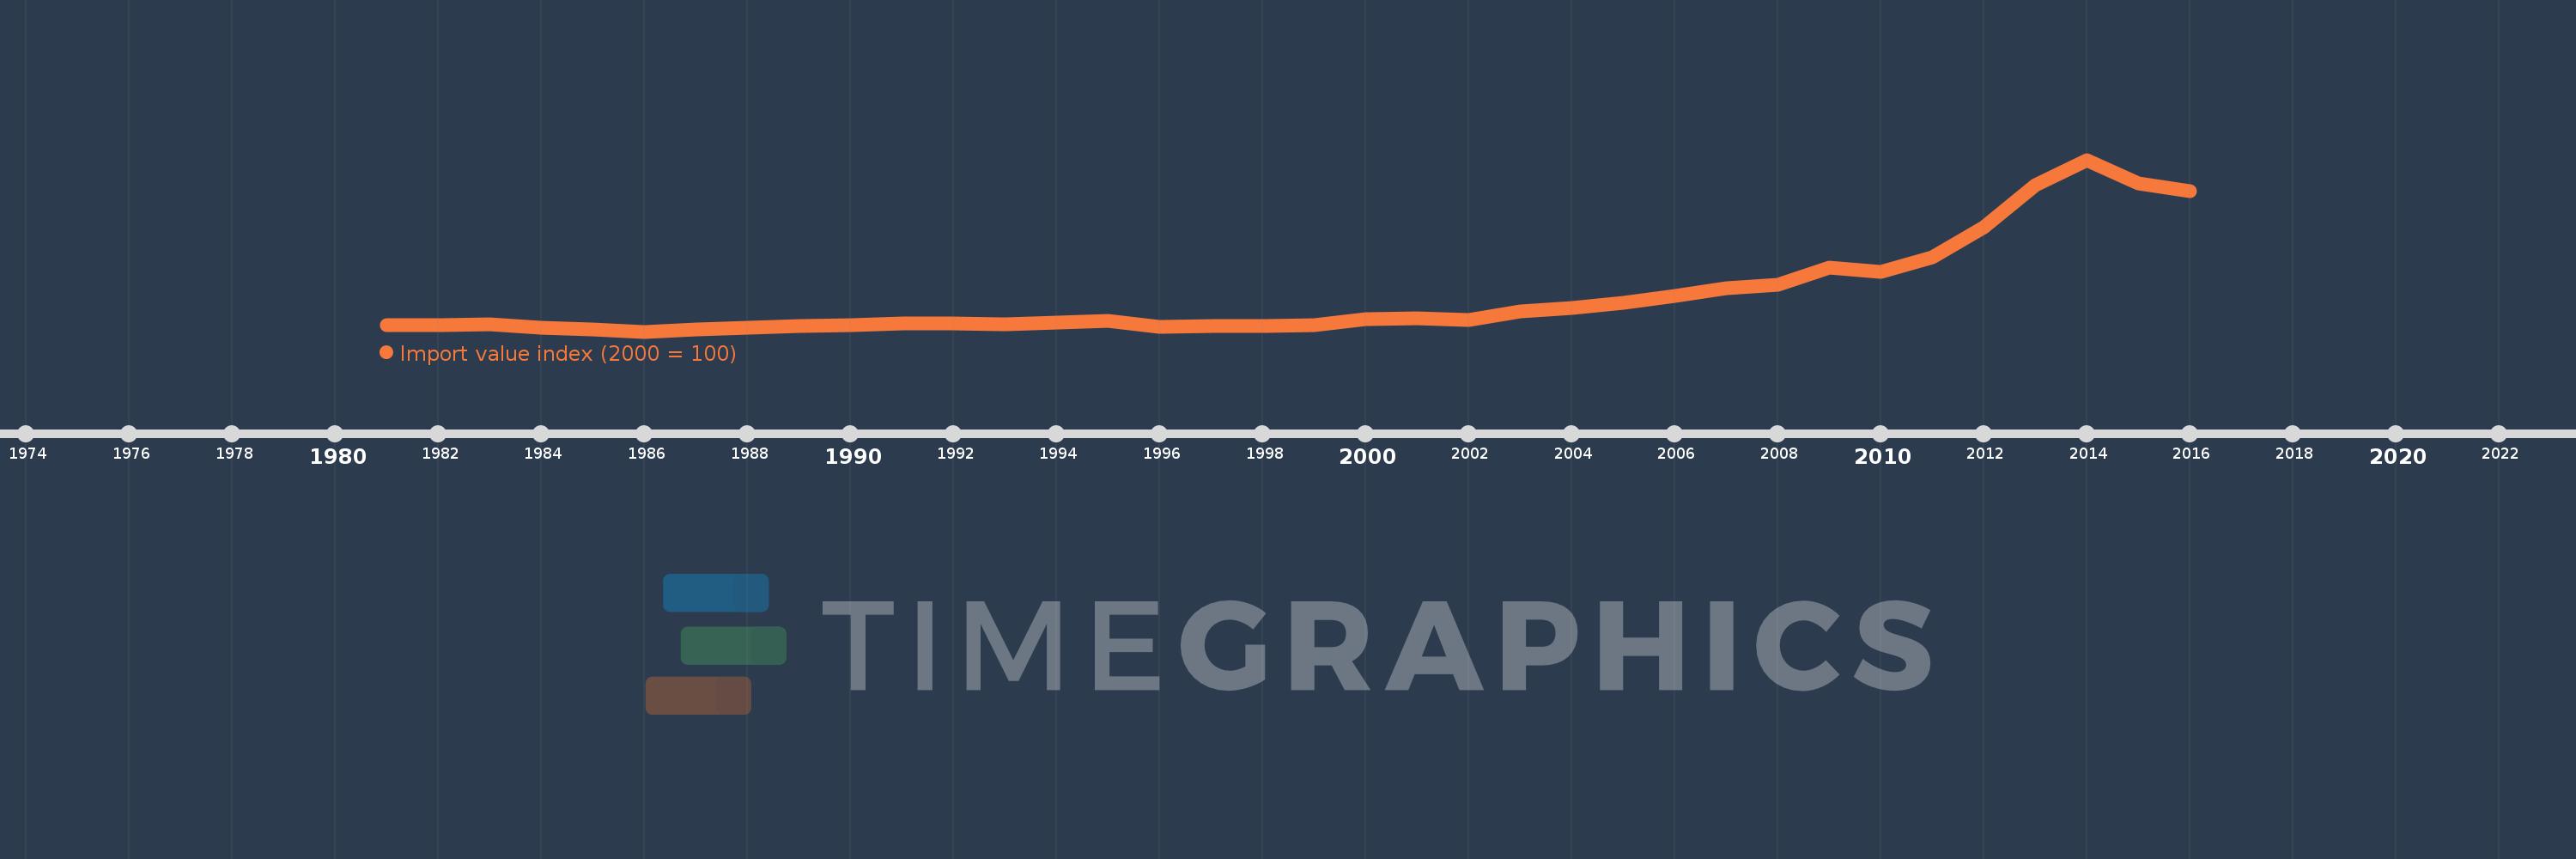
Import value index (2000 = 100)
2016,2015,2014,2013,2012,2011,2010,2009,2008,2007,2006,2005,2004,2003,2002,2001,2000,1999,1998,1997,1996,1995,1994,1993,1992,1991,1990,1989,1988,1987,1986,1985,1984,1983,1982,1981
Estas estadísticas en otros países:
AfghanistanAlbaniaAlgeriaAmerican SamoaAndorraAngolaAntigua and BarbudaArgentinaArmeniaArubaAustraliaAustriaAzerbaijanBahamas, TheBahrainBangladeshBarbadosBelarusBelgiumBelizeBeninBermudaBhutanBoliviaBosnia and HerzegovinaBotswanaBrazilBritish Virgin IslandsBrunei DarussalamBulgariaBurkina FasoBurundiCabo VerdeCambodiaCameroonCanadaCayman IslandsCentral African RepublicChadChileChinaColombiaComorosCongo, Dem. Rep.Congo, Rep.Costa RicaCote d'IvoireCroatiaCubaCuracaoCyprusCzech RepublicDenmarkDjiboutiDominicaDominican RepublicEcuadorEgypt, Arab Rep.El SalvadorEquatorial GuineaEritreaEstoniaEthiopiaFaroe IslandsFijiFinlandFranceFrench PolynesiaGabonGambia, TheGeorgiaGermanyGhanaGibraltarGreeceGreenlandGrenadaGuamGuatemalaGuineaGuinea-BissauGuyanaHaitiHondurasHong Kong SAR, ChinaHungaryIcelandIndiaIndonesiaIran, Islamic Rep.IraqIrelandIsraelItalyJamaicaJapanJordanKazakhstanKenyaKiribatiKorea, Dem. People’s Rep.Korea, Rep.KuwaitKyrgyz RepublicLao PDRLatviaLebanonLesothoLiberiaLibyaLithuaniaLuxembourgMacao SAR, ChinaMacedonia, FYRMadagascarMalawiMalaysiaMaldivesMaliMaltaMarshall IslandsMauritaniaMauritiusMexicoMicronesia, Fed. Sts.MoldovaMongoliaMoroccoMozambiqueMyanmarNamibiaNauruNepalNetherlandsNew CaledoniaNew ZealandNicaraguaNigerNigeriaNorthern Mariana IslandsNorwayOmanPakistanPalauPanamaPapua New GuineaParaguayPeruPhilippinesPolandPortugalQatarRomaniaRussian FederationRwandaSamoaSao Tome and PrincipeSaudi ArabiaSenegalSerbiaSeychellesSierra LeoneSingaporeSlovak RepublicSloveniaSolomon IslandsSomaliaSouth AfricaSpainSri LankaSt. Kitts and NevisSt. LuciaSt. Vincent and the GrenadinesSudanSurinameSwazilandSwedenSwitzerlandSyrian Arab RepublicTajikistanTanzaniaThailandTogoTongaTrinidad and TobagoTunisiaTurkeyTurkmenistanTurks and Caicos IslandsUgandaUkraineUnited Arab EmiratesUnited KingdomUnited StatesUruguayUzbekistanVanuatuVenezuela, RBVietnamWest Bank and GazaYemen, Rep.ZambiaZimbabwe línea de tiempo (timeline):
En esta escala de tiempo se presenta un gráfico de 1981 y 2016 de Mozambique. Los datos de 1980 están ausentes. El número de observaciones reales por fecha: 36.
Fuente (nombre):
Indicadores del desarrollo mundial
Fuente (organización):
United Nations Conference on Trade and Development, Handbook of Statistics and data files, and International Monetary Fund, International Financial Statistics.
Categorías:
Private Sector, Trade
Se ha actualizado:
23 abr 2017 año
Los indicadores de los cambios de valor en los últimos años
Mínimo:
36.615
1 ene 1986 año
Máximo:
872.119
1 ene 2014 año
A la fecha de observación
Valor
Cambio absoluto
El cambio con respecto al valor anterior
1 ene 1981 año
69.085
+69.085
0.0%
1 ene 1982 año
69.171
+0.086
0.13%
1 ene 1983 año
72.193
+3.022
4.37%
1 ene 1984 año
54.922
-17.271
-23.92%
1 ene 1985 año
46.632
-8.29
-15.09%
1 ene 1986 año
36.615
-10.017
-21.48%
1 ene 1987 año
46.891
+10.276
28.07%
1 ene 1988 año
55.44
+8.549
18.23%
1 ene 1989 año
63.558
+8.117
14.64%
1 ene 1990 año
69.775
+6.218
9.78%
1 ene 1991 año
75.82
+6.045
8.66%
1 ene 1992 año
77.634
+1.813
2.39%
1 ene 1993 año
73.834
-3.8
-4.89%
1 ene 1994 año
82.47
+8.636
11.7%
1 ene 1995 año
87.997
+5.527
6.7%
1 ene 1996 año
60.794
-27.202
-30.91%
1 ene 1997 año
65.544
+4.75
7.81%
1 ene 1998 año
63.817
-1.727
-2.64%
1 ene 1999 año
68.221
+4.404
6.9%
1 ene 2000 año
98.359
+30.138
44.18%
1 ene 2001 año
100.0
+1.641
1.67%
1 ene 2002 año
91.796
-8.204
-8.2%
1 ene 2003 año
133.247
+41.451
45.16%
1 ene 2004 año
151.382
+18.135
13.61%
1 ene 2005 año
175.706
+24.324
16.07%
1 ene 2006 año
207.962
+32.256
18.36%
1 ene 2007 año
247.779
+39.817
19.15%
1 ene 2008 año
263.363
+15.585
6.29%
1 ene 2009 año
346.094
+82.73
31.41%
1 ene 2010 año
325.061
-21.032
-6.08%
1 ene 2011 año
397.237
+72.176
22.2%
1 ene 2012 año
545.091
+147.855
37.22%
1 ene 2013 año
750.256
+205.165
37.64%
1 ene 2014 año
872.119
+121.862
16.24%
1 ene 2015 año
755.339
-116.78
-13.39%
1 ene 2016 año
721.675
-33.663
-4.46%
Ranking de los países por los datos estadísticos actuales


Comentarios: