29
/es/
es
AIzaSyAYiBZKx7MnpbEhh9jyipgxe19OcubqV5w
April 1, 2024
287256
Zimbabwe
ZWE
true
2
1
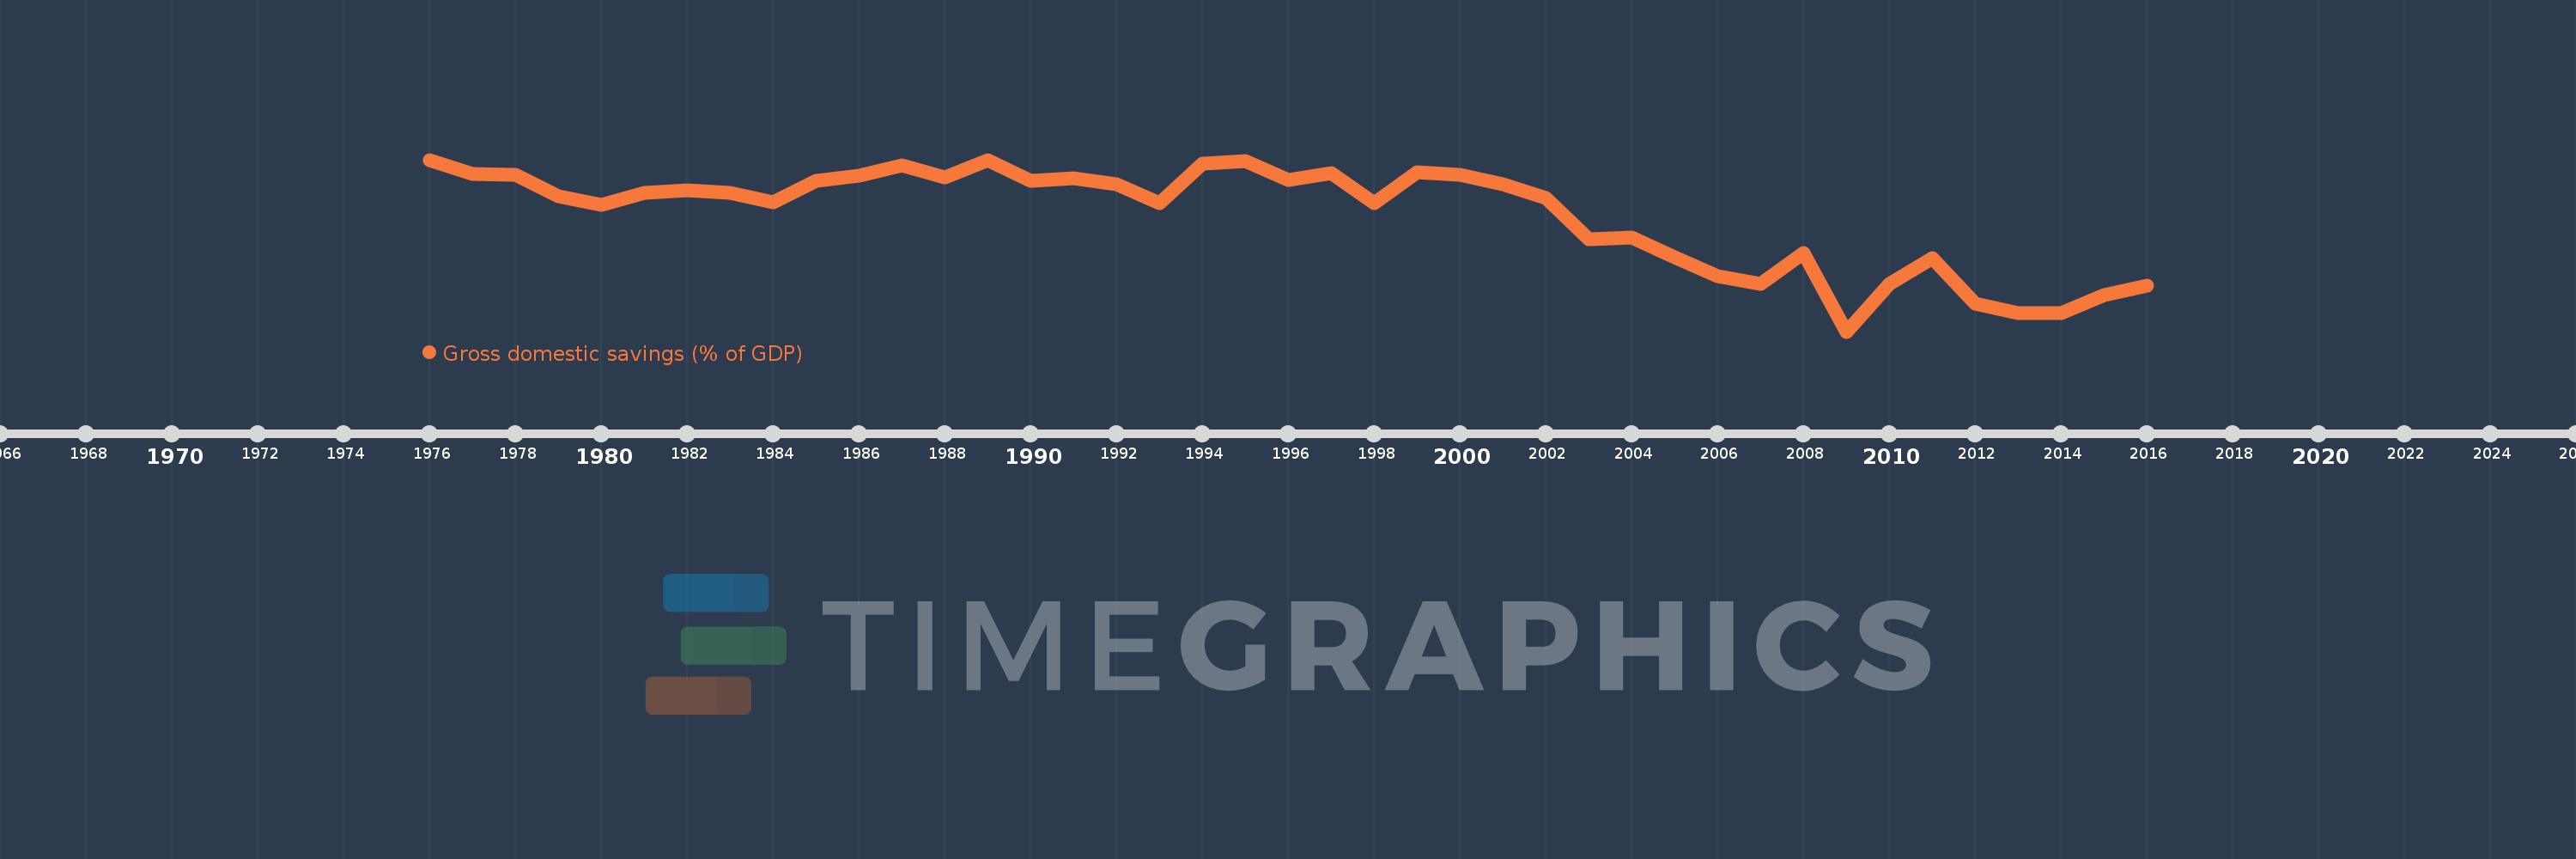
Gross domestic savings (% of GDP)
2016,2015,2014,2013,2012,2011,2010,2009,2008,2007,2006,2005,2004,2003,2002,2001,2000,1999,1998,1997,1996,1995,1994,1993,1992,1991,1990,1989,1988,1987,1986,1985,1984,1983,1982,1981,1980,1979,1978,1977,1976
Estas estadísticas en otros países:
AfghanistanAlbaniaAlgeriaAngolaAntigua and BarbudaArab WorldArgentinaArmeniaArubaAustraliaAustriaAzerbaijanBahamas, TheBahrainBangladeshBarbadosBelarusBelgiumBelizeBeninBermudaBhutanBoliviaBosnia and HerzegovinaBotswanaBrazilBrunei DarussalamBulgariaBurkina FasoBurundiCabo VerdeCambodiaCameroonCanadaCaribbean small statesCentral African RepublicCentral Europe and the BalticsChadChileChinaColombiaComorosCongo, Dem. Rep.Congo, Rep.Costa RicaCote d'IvoireCroatiaCubaCyprusCzech RepublicDenmarkDjiboutiDominicaDominican RepublicEarly-demographic dividendEast Asia & PacificEast Asia & Pacific (excluding high income)East Asia & Pacific (IDA & IBRD countries)EcuadorEgypt, Arab Rep.El SalvadorEquatorial GuineaEritreaEstoniaEthiopiaEuro areaEurope & Central AsiaEurope & Central Asia (excluding high income)Europe & Central Asia (IDA & IBRD countries)European UnionFaroe IslandsFijiFinlandFragile and conflict affected situationsFranceGabonGambia, TheGeorgiaGermanyGhanaGreeceGrenadaGuatemalaGuineaGuinea-BissauGuyanaHaitiHeavily indebted poor countries (HIPC)High incomeHondurasHong Kong SAR, ChinaHungaryIBRD onlyIcelandIDA & IBRD totalIDA blendIDA onlyIDA totalIndiaIndonesiaIran, Islamic Rep.IraqIrelandIsraelItalyJamaicaJapanJordanKazakhstanKenyaKiribatiKorea, Rep.KosovoKuwaitKyrgyz RepublicLao PDRLate-demographic dividendLatin America & Caribbean Latin America & Caribbean (excluding high income)Latin America & the Caribbean (IDA & IBRD countries)LatviaLeast developed countries: UN classificationLebanonLesothoLiberiaLibyaLithuaniaLow & middle incomeLow incomeLower middle incomeLuxembourgMacao SAR, ChinaMacedonia, FYRMadagascarMalawiMalaysiaMaldivesMaliMaltaMauritaniaMauritiusMexicoMicronesia, Fed. Sts.Middle East & North AfricaMiddle East & North Africa (excluding high income)Middle East & North Africa (IDA & IBRD countries)Middle incomeMoldovaMongoliaMontenegroMoroccoMozambiqueNamibiaNepalNetherlandsNew CaledoniaNew ZealandNicaraguaNigerNigeriaNorth AmericaNorwayOECD membersOmanOther small statesPacific island small statesPakistanPanamaPapua New GuineaParaguayPeruPhilippinesPolandPortugalPost-demographic dividendPre-demographic dividendPuerto RicoQatarRomaniaRussian FederationRwandaSaudi ArabiaSenegalSerbiaSeychellesSierra LeoneSingaporeSlovak RepublicSloveniaSmall statesSolomon IslandsSomaliaSouth AfricaSouth AsiaSouth Asia (IDA & IBRD)South SudanSpainSri LankaSt. Kitts and NevisSt. LuciaSt. Vincent and the GrenadinesSub-Saharan Africa Sub-Saharan Africa (excluding high income)Sub-Saharan Africa (IDA & IBRD countries)SudanSurinameSwazilandSwedenSwitzerlandSyrian Arab RepublicTajikistanTanzaniaThailandTimor-LesteTogoTongaTrinidad and TobagoTunisiaTurkeyTurkmenistanUgandaUkraineUnited Arab EmiratesUnited KingdomUnited StatesUpper middle incomeUruguayUzbekistanVanuatuVenezuela, RBVietnamWest Bank and GazaWorldYemen, Rep.ZambiaZimbabwe línea de tiempo (timeline):
En esta escala de tiempo se presenta un gráfico de 1976 y 2016 de Zimbabwe. Los datos de 1975 están ausentes. El número de observaciones reales por fecha: 41.
Fuente (nombre):
Indicadores del desarrollo mundial
Fuente (organización):
World Bank national accounts data, and OECD National Accounts data files.
Categorías:
Economy & Growth
Se ha actualizado:
23 abr 2017 año
Los indicadores de los cambios de valor en los últimos años
Mínimo:
-21.46
1 ene 2009 año
Máximo:
22.082
1 ene 1989 año
A la fecha de observación
Valor
Cambio absoluto
El cambio con respecto al valor anterior
1 ene 1976 año
21.964
+21.964
0.0%
1 ene 1977 año
18.474
-3.49
-15.89%
1 ene 1978 año
18.363
-0.111
-0.6%
1 ene 1979 año
12.731
-5.632
-30.67%
1 ene 1980 año
10.548
-2.183
-17.15%
1 ene 1981 año
13.781
+3.233
30.65%
1 ene 1982 año
14.336
+0.554
4.02%
1 ene 1983 año
13.76
-0.576
-4.02%
1 ene 1984 año
11.274
-2.485
-18.06%
1 ene 1985 año
16.792
+5.517
48.94%
1 ene 1986 año
18.018
+1.226
7.3%
1 ene 1987 año
20.585
+2.567
14.25%
1 ene 1988 año
17.677
-2.908
-14.13%
1 ene 1989 año
22.082
+4.405
24.92%
1 ene 1990 año
16.66
-5.422
-24.55%
1 ene 1991 año
17.451
+0.791
4.75%
1 ene 1992 año
15.819
-1.633
-9.36%
1 ene 1993 año
10.979
-4.839
-30.59%
1 ene 1994 año
21.047
+10.068
91.7%
1 ene 1995 año
21.81
+0.762
3.62%
1 ene 1996 año
16.976
-4.833
-22.16%
1 ene 1997 año
18.732
+1.756
10.35%
1 ene 1998 año
11.119
-7.613
-40.64%
1 ene 1999 año
19.023
+7.903
71.08%
1 ene 2000 año
18.291
-0.732
-3.85%
1 ene 2001 año
15.822
-2.469
-13.5%
1 ene 2002 año
12.286
-3.535
-22.34%
1 ene 2003 año
1.862
-10.424
-84.84%
1 ene 2004 año
2.342
+0.48
25.77%
1 ene 2005 año
-2.591
-4.933
-210.62%
1 ene 2006 año
-7.421
-4.83
186.44%
1 ene 2007 año
-9.337
-1.916
25.82%
1 ene 2008 año
-1.492
+7.845
-84.02%
1 ene 2009 año
-21.46
-19.968
1.34 mil%
1 ene 2010 año
-9.347
+12.113
-56.44%
1 ene 2011 año
-2.829
+6.518
-69.73%
1 ene 2012 año
-14.319
-11.49
406.14%
1 ene 2013 año
-16.71
-2.391
16.7%
1 ene 2014 año
-16.865
-0.155
0.93%
1 ene 2015 año
-12.201
+4.664
-27.65%
1 ene 2016 año
-9.89
+2.311
-18.94%
Ranking de los países por los datos estadísticos actuales


Comentarios: