29
/es/
es
AIzaSyAYiBZKx7MnpbEhh9jyipgxe19OcubqV5w
April 1, 2024
219621
Papua New Guinea
PNG
true
2
1
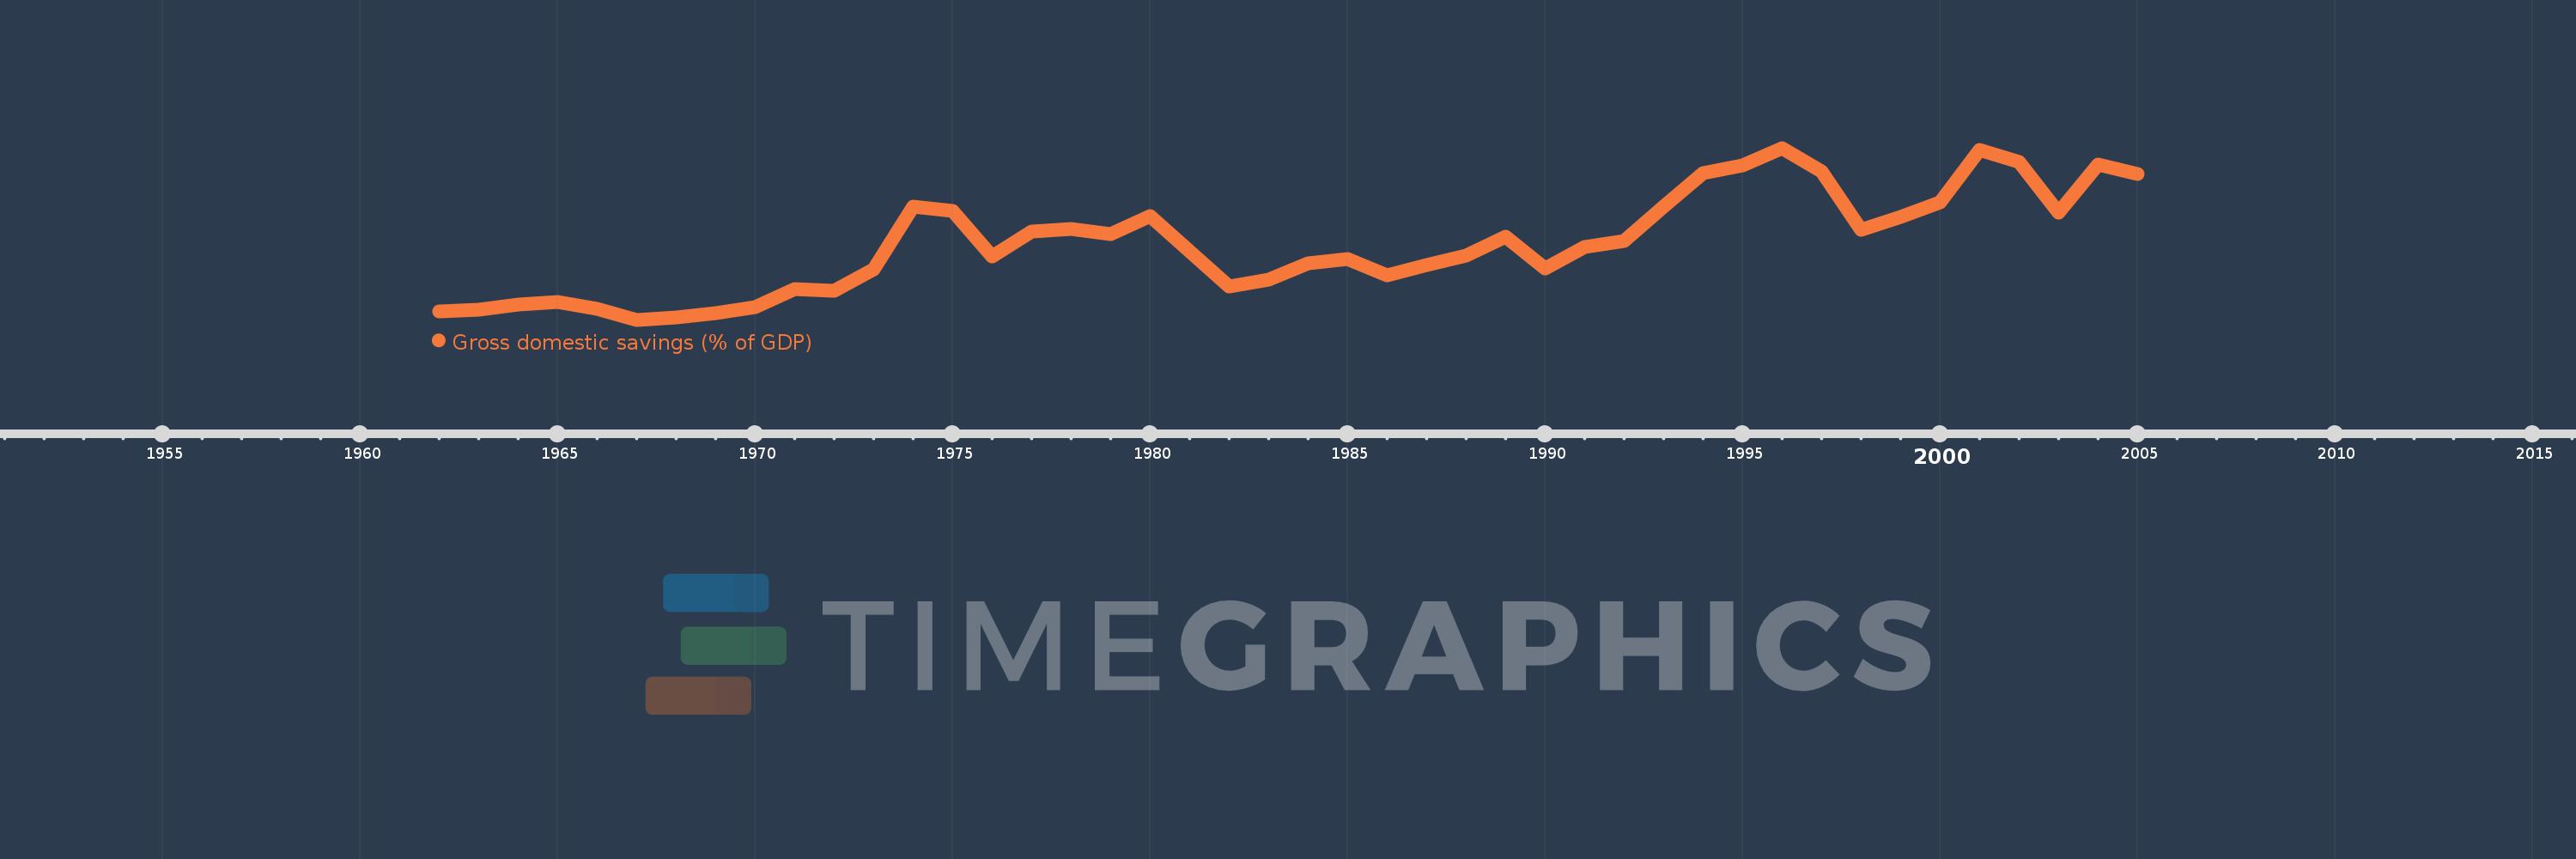
Gross domestic savings (% of GDP)
2005,2004,2003,2002,2001,2000,1999,1998,1997,1996,1995,1994,1993,1992,1991,1990,1989,1988,1987,1986,1985,1984,1983,1982,1981,1980,1979,1978,1977,1976,1975,1974,1973,1972,1971,1970,1969,1968,1967,1966,1965,1964,1963,1962
Estas estadísticas en otros países:
AfghanistanAlbaniaAlgeriaAngolaAntigua and BarbudaArab WorldArgentinaArmeniaArubaAustraliaAustriaAzerbaijanBahamas, TheBahrainBangladeshBarbadosBelarusBelgiumBelizeBeninBermudaBhutanBoliviaBosnia and HerzegovinaBotswanaBrazilBrunei DarussalamBulgariaBurkina FasoBurundiCabo VerdeCambodiaCameroonCanadaCaribbean small statesCentral African RepublicCentral Europe and the BalticsChadChileChinaColombiaComorosCongo, Dem. Rep.Congo, Rep.Costa RicaCote d'IvoireCroatiaCubaCyprusCzech RepublicDenmarkDjiboutiDominicaDominican RepublicEarly-demographic dividendEast Asia & PacificEast Asia & Pacific (excluding high income)East Asia & Pacific (IDA & IBRD countries)EcuadorEgypt, Arab Rep.El SalvadorEquatorial GuineaEritreaEstoniaEthiopiaEuro areaEurope & Central AsiaEurope & Central Asia (excluding high income)Europe & Central Asia (IDA & IBRD countries)European UnionFaroe IslandsFijiFinlandFragile and conflict affected situationsFranceGabonGambia, TheGeorgiaGermanyGhanaGreeceGrenadaGuatemalaGuineaGuinea-BissauGuyanaHaitiHeavily indebted poor countries (HIPC)High incomeHondurasHong Kong SAR, ChinaHungaryIBRD onlyIcelandIDA & IBRD totalIDA blendIDA onlyIDA totalIndiaIndonesiaIran, Islamic Rep.IraqIrelandIsraelItalyJamaicaJapanJordanKazakhstanKenyaKiribatiKorea, Rep.KosovoKuwaitKyrgyz RepublicLao PDRLate-demographic dividendLatin America & Caribbean Latin America & Caribbean (excluding high income)Latin America & the Caribbean (IDA & IBRD countries)LatviaLeast developed countries: UN classificationLebanonLesothoLiberiaLibyaLithuaniaLow & middle incomeLow incomeLower middle incomeLuxembourgMacao SAR, ChinaMacedonia, FYRMadagascarMalawiMalaysiaMaldivesMaliMaltaMauritaniaMauritiusMexicoMicronesia, Fed. Sts.Middle East & North AfricaMiddle East & North Africa (excluding high income)Middle East & North Africa (IDA & IBRD countries)Middle incomeMoldovaMongoliaMontenegroMoroccoMozambiqueNamibiaNepalNetherlandsNew CaledoniaNew ZealandNicaraguaNigerNigeriaNorth AmericaNorwayOECD membersOmanOther small statesPacific island small statesPakistanPanamaPapua New GuineaParaguayPeruPhilippinesPolandPortugalPost-demographic dividendPre-demographic dividendPuerto RicoQatarRomaniaRussian FederationRwandaSaudi ArabiaSenegalSerbiaSeychellesSierra LeoneSingaporeSlovak RepublicSloveniaSmall statesSolomon IslandsSomaliaSouth AfricaSouth AsiaSouth Asia (IDA & IBRD)South SudanSpainSri LankaSt. Kitts and NevisSt. LuciaSt. Vincent and the GrenadinesSub-Saharan Africa Sub-Saharan Africa (excluding high income)Sub-Saharan Africa (IDA & IBRD countries)SudanSurinameSwazilandSwedenSwitzerlandSyrian Arab RepublicTajikistanTanzaniaThailandTimor-LesteTogoTongaTrinidad and TobagoTunisiaTurkeyTurkmenistanUgandaUkraineUnited Arab EmiratesUnited KingdomUnited StatesUpper middle incomeUruguayUzbekistanVanuatuVenezuela, RBVietnamWest Bank and GazaWorldYemen, Rep.ZambiaZimbabwe línea de tiempo (timeline):
En esta escala de tiempo se presenta un gráfico de 1962 y 2005 de Papua New Guinea. Los datos de 1961 están ausentes. El número de observaciones reales por fecha: 44.
Fuente (nombre):
Indicadores del desarrollo mundial
Fuente (organización):
World Bank national accounts data, and OECD National Accounts data files.
Categorías:
Economy & Growth
Se ha actualizado:
23 abr 2017 año
Los indicadores de los cambios de valor en los últimos años
Mínimo:
-0.945
1 ene 1967 año
Máximo:
39.277
1 ene 1996 año
A la fecha de observación
Valor
Cambio absoluto
El cambio con respecto al valor anterior
1 ene 1962 año
1.098
+1.098
0.0%
1 ene 1963 año
1.501
+0.403
36.7%
1 ene 1964 año
2.516
+1.015
67.65%
1 ene 1965 año
3.118
+0.602
23.92%
1 ene 1966 año
1.66
-1.459
-46.78%
1 ene 1967 año
-0.945
-2.605
-156.96%
1 ene 1968 año
-0.33
+0.616
-65.13%
1 ene 1969 año
0.508
+0.837
-254.07%
1 ene 1970 año
2.072
+1.564
308.06%
1 ene 1971 año
6.142
+4.069
196.36%
1 ene 1972 año
5.887
-0.255
-4.15%
1 ene 1973 año
10.793
+4.906
83.34%
1 ene 1974 año
25.538
+14.745
136.61%
1 ene 1975 año
24.464
-1.074
-4.21%
1 ene 1976 año
13.857
-10.607
-43.36%
1 ene 1977 año
19.64
+5.783
41.73%
1 ene 1978 año
20.308
+0.668
3.4%
1 ene 1979 año
19.14
-1.168
-5.75%
1 ene 1980 año
23.368
+4.228
22.09%
1 ene 1981 año
15.069
-8.298
-35.51%
1 ene 1982 año
6.745
-8.324
-55.24%
1 ene 1983 año
8.495
+1.75
25.95%
1 ene 1984 año
12.182
+3.687
43.4%
1 ene 1985 año
13.293
+1.111
9.12%
1 ene 1986 año
9.505
-3.788
-28.5%
1 ene 1987 año
11.962
+2.457
25.86%
1 ene 1988 año
14.0
+2.038
17.04%
1 ene 1989 año
18.536
+4.536
32.4%
1 ene 1990 año
11.124
-7.412
-39.99%
1 ene 1991 año
16.121
+4.997
44.92%
1 ene 1992 año
17.514
+1.394
8.65%
1 ene 1993 año
25.451
+7.937
45.32%
1 ene 1994 año
33.332
+7.881
30.96%
1 ene 1995 año
35.133
+1.801
5.4%
1 ene 1996 año
39.277
+4.144
11.8%
1 ene 1997 año
33.751
-5.526
-14.07%
1 ene 1998 año
20.165
-13.587
-40.25%
1 ene 1999 año
23.129
+2.964
14.7%
1 ene 2000 año
26.598
+3.47
15.0%
1 ene 2001 año
38.827
+12.229
45.98%
1 ene 2002 año
36.031
-2.795
-7.2%
1 ene 2003 año
24.104
-11.927
-33.1%
1 ene 2004 año
35.308
+11.204
46.48%
1 ene 2005 año
33.246
-2.062
-5.84%
Ranking de los países por los datos estadísticos actuales


Comentarios: