29
/es/
es
AIzaSyAYiBZKx7MnpbEhh9jyipgxe19OcubqV5w
April 1, 2024
235821
Senegal
SEN
true
2
1
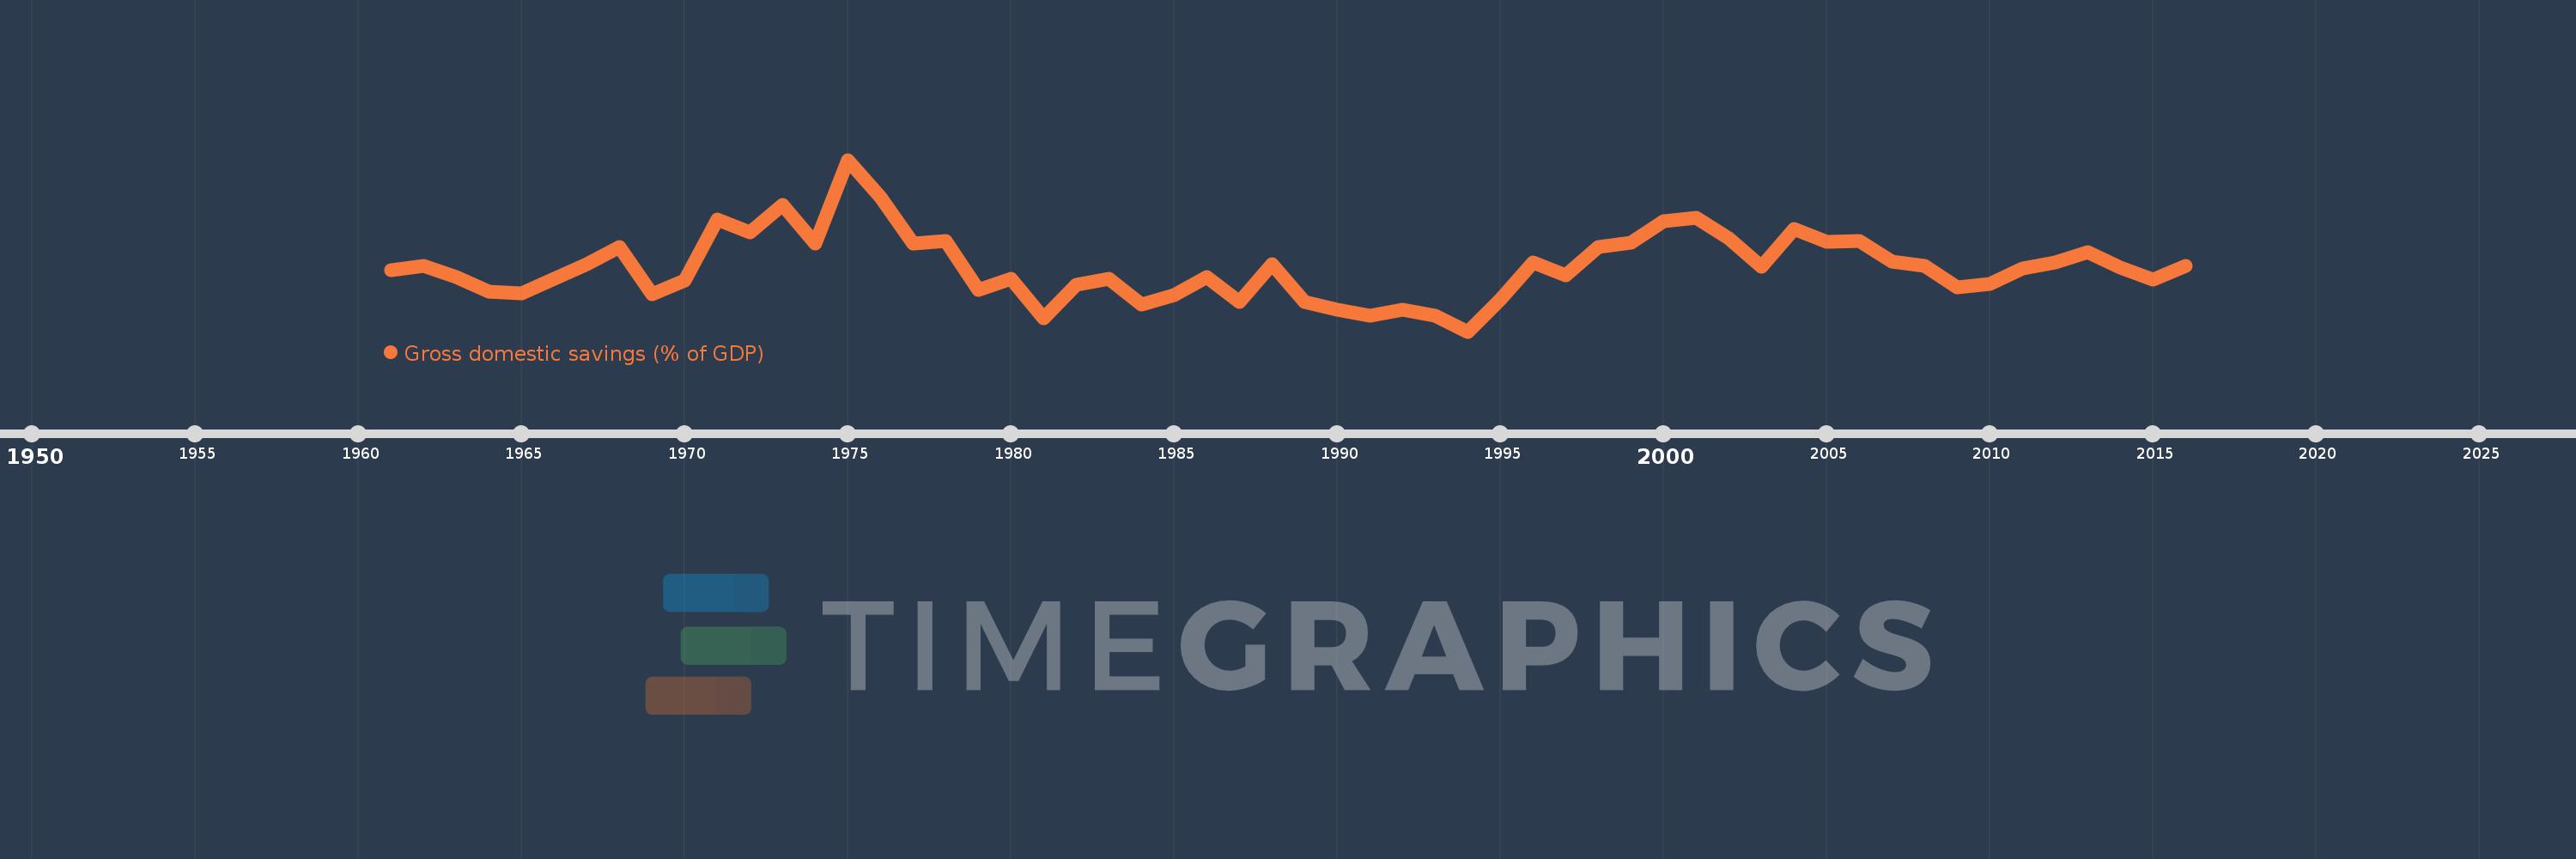
Gross domestic savings (% of GDP)
2016,2015,2014,2013,2012,2011,2010,2009,2008,2007,2006,2005,2004,2003,2002,2001,2000,1999,1998,1997,1996,1995,1994,1993,1992,1991,1990,1989,1988,1987,1986,1985,1984,1983,1982,1981,1980,1979,1978,1977,1976,1975,1974,1973,1972,1971,1970,1969,1968,1967,1966,1965,1964,1963,1962,1961
Estas estadísticas en otros países:
AfghanistanAlbaniaAlgeriaAngolaAntigua and BarbudaArab WorldArgentinaArmeniaArubaAustraliaAustriaAzerbaijanBahamas, TheBahrainBangladeshBarbadosBelarusBelgiumBelizeBeninBermudaBhutanBoliviaBosnia and HerzegovinaBotswanaBrazilBrunei DarussalamBulgariaBurkina FasoBurundiCabo VerdeCambodiaCameroonCanadaCaribbean small statesCentral African RepublicCentral Europe and the BalticsChadChileChinaColombiaComorosCongo, Dem. Rep.Congo, Rep.Costa RicaCote d'IvoireCroatiaCubaCyprusCzech RepublicDenmarkDjiboutiDominicaDominican RepublicEarly-demographic dividendEast Asia & PacificEast Asia & Pacific (excluding high income)East Asia & Pacific (IDA & IBRD countries)EcuadorEgypt, Arab Rep.El SalvadorEquatorial GuineaEritreaEstoniaEthiopiaEuro areaEurope & Central AsiaEurope & Central Asia (excluding high income)Europe & Central Asia (IDA & IBRD countries)European UnionFaroe IslandsFijiFinlandFragile and conflict affected situationsFranceGabonGambia, TheGeorgiaGermanyGhanaGreeceGrenadaGuatemalaGuineaGuinea-BissauGuyanaHaitiHeavily indebted poor countries (HIPC)High incomeHondurasHong Kong SAR, ChinaHungaryIBRD onlyIcelandIDA & IBRD totalIDA blendIDA onlyIDA totalIndiaIndonesiaIran, Islamic Rep.IraqIrelandIsraelItalyJamaicaJapanJordanKazakhstanKenyaKiribatiKorea, Rep.KosovoKuwaitKyrgyz RepublicLao PDRLate-demographic dividendLatin America & Caribbean Latin America & Caribbean (excluding high income)Latin America & the Caribbean (IDA & IBRD countries)LatviaLeast developed countries: UN classificationLebanonLesothoLiberiaLibyaLithuaniaLow & middle incomeLow incomeLower middle incomeLuxembourgMacao SAR, ChinaMacedonia, FYRMadagascarMalawiMalaysiaMaldivesMaliMaltaMauritaniaMauritiusMexicoMicronesia, Fed. Sts.Middle East & North AfricaMiddle East & North Africa (excluding high income)Middle East & North Africa (IDA & IBRD countries)Middle incomeMoldovaMongoliaMontenegroMoroccoMozambiqueNamibiaNepalNetherlandsNew CaledoniaNew ZealandNicaraguaNigerNigeriaNorth AmericaNorwayOECD membersOmanOther small statesPacific island small statesPakistanPanamaPapua New GuineaParaguayPeruPhilippinesPolandPortugalPost-demographic dividendPre-demographic dividendPuerto RicoQatarRomaniaRussian FederationRwandaSaudi ArabiaSenegalSerbiaSeychellesSierra LeoneSingaporeSlovak RepublicSloveniaSmall statesSolomon IslandsSomaliaSouth AfricaSouth AsiaSouth Asia (IDA & IBRD)South SudanSpainSri LankaSt. Kitts and NevisSt. LuciaSt. Vincent and the GrenadinesSub-Saharan Africa Sub-Saharan Africa (excluding high income)Sub-Saharan Africa (IDA & IBRD countries)SudanSurinameSwazilandSwedenSwitzerlandSyrian Arab RepublicTajikistanTanzaniaThailandTimor-LesteTogoTongaTrinidad and TobagoTunisiaTurkeyTurkmenistanUgandaUkraineUnited Arab EmiratesUnited KingdomUnited StatesUpper middle incomeUruguayUzbekistanVanuatuVenezuela, RBVietnamWest Bank and GazaWorldYemen, Rep.ZambiaZimbabwe línea de tiempo (timeline):
En esta escala de tiempo se presenta un gráfico de 1961 y 2016 de Senegal. Los datos de 1960 están ausentes. El número de observaciones reales por fecha: 56.
Fuente (nombre):
Indicadores del desarrollo mundial
Fuente (organización):
World Bank national accounts data, and OECD National Accounts data files.
Categorías:
Economy & Growth
Se ha actualizado:
23 abr 2017 año
Los indicadores de los cambios de valor en los últimos años
Mínimo:
0.91
1 ene 1994 año
Máximo:
16.407
1 ene 1975 año
A la fecha de observación
Valor
Cambio absoluto
El cambio con respecto al valor anterior
1 ene 1961 año
6.437
+6.437
0.0%
1 ene 1962 año
6.876
+0.439
6.82%
1 ene 1963 año
5.835
-1.042
-15.15%
1 ene 1964 año
4.511
-1.324
-22.69%
1 ene 1965 año
4.355
-0.156
-3.45%
1 ene 1966 año
5.668
+1.313
30.14%
1 ene 1967 año
6.973
+1.306
23.04%
1 ene 1968 año
8.557
+1.584
22.71%
1 ene 1969 año
4.288
-4.269
-49.89%
1 ene 1970 año
5.535
+1.247
29.09%
1 ene 1971 año
11.045
+5.51
99.55%
1 ene 1972 año
9.833
-1.212
-10.98%
1 ene 1973 año
12.347
+2.514
25.57%
1 ene 1974 año
8.825
-3.522
-28.53%
1 ene 1975 año
16.407
+7.583
85.93%
1 ene 1976 año
13.028
-3.379
-20.6%
1 ene 1977 año
8.871
-4.157
-31.91%
1 ene 1978 año
9.055
+0.184
2.08%
1 ene 1979 año
4.632
-4.424
-48.85%
1 ene 1980 año
5.671
+1.039
22.44%
1 ene 1981 año
2.133
-3.538
-62.39%
1 ene 1982 año
5.102
+2.969
139.21%
1 ene 1983 año
5.647
+0.545
10.69%
1 ene 1984 año
3.341
-2.307
-40.84%
1 ene 1985 año
4.176
+0.835
24.98%
1 ene 1986 año
5.793
+1.618
38.74%
1 ene 1987 año
3.614
-2.179
-37.62%
1 ene 1988 año
6.957
+3.343
92.49%
1 ene 1989 año
3.617
-3.339
-48.0%
1 ene 1990 año
2.9
-0.718
-19.84%
1 ene 1991 año
2.364
-0.536
-18.48%
1 ene 1992 año
2.9
+0.536
22.69%
1 ene 1993 año
2.36
-0.54
-18.62%
1 ene 1994 año
0.91
-1.451
-61.47%
1 ene 1995 año
3.815
+2.906
319.47%
1 ene 1996 año
7.159
+3.344
87.65%
1 ene 1997 año
5.954
-1.206
-16.84%
1 ene 1998 año
8.554
+2.6
43.66%
1 ene 1999 año
8.95
+0.396
4.64%
1 ene 2000 año
10.896
+1.946
21.74%
1 ene 2001 año
11.169
+0.274
2.51%
1 ene 2002 año
9.352
-1.818
-16.27%
1 ene 2003 año
6.76
-2.592
-27.72%
1 ene 2004 año
10.162
+3.403
50.34%
1 ene 2005 año
8.995
-1.167
-11.49%
1 ene 2006 año
9.08
+0.085
0.94%
1 ene 2007 año
7.232
-1.848
-20.35%
1 ene 2008 año
6.852
-0.379
-5.25%
1 ene 2009 año
4.898
-1.955
-28.53%
1 ene 2010 año
5.172
+0.275
5.61%
1 ene 2011 año
6.639
+1.466
28.35%
1 ene 2012 año
7.162
+0.523
7.88%
1 ene 2013 año
8.07
+0.909
12.69%
1 ene 2014 año
6.668
-1.402
-17.37%
1 ene 2015 año
5.631
-1.037
-15.55%
1 ene 2016 año
6.8
+1.169
20.75%
Ranking de los países por los datos estadísticos actuales


Comentarios: