29
/es/
es
AIzaSyAYiBZKx7MnpbEhh9jyipgxe19OcubqV5w
April 1, 2024
282343
Vietnam
VNM
true
2
1
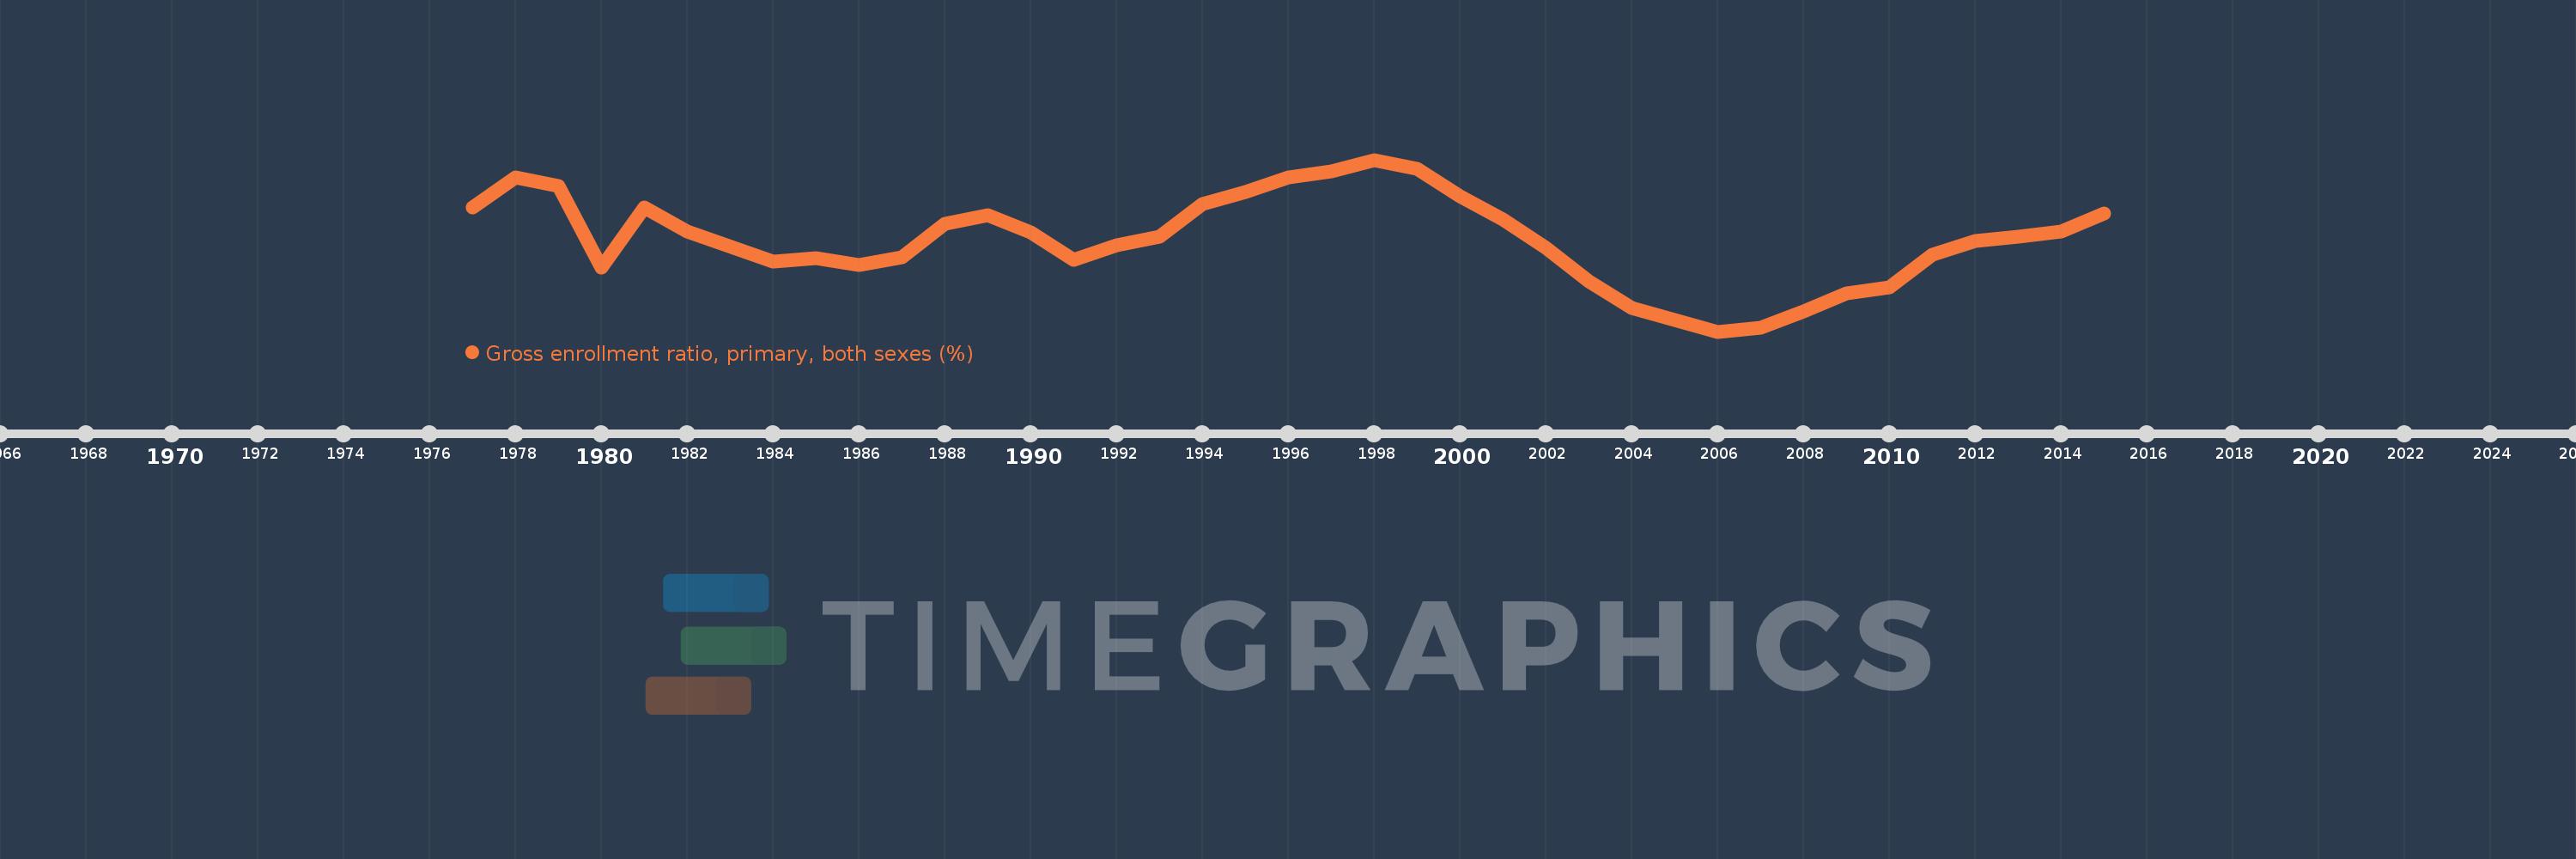
Gross enrollment ratio, primary, both sexes (%)
2015,2014,2013,2012,2011,2010,2009,2008,2007,2006,2005,2004,2003,2002,2001,2000,1999,1998,1997,1996,1995,1994,1993,1992,1991,1990,1989,1988,1987,1986,1985,1984,1982,1981,1980,1979,1978,1977
Estas estadísticas en otros países:
AfghanistanAlbaniaAlgeriaAndorraAngolaAntigua and BarbudaArab WorldArgentinaArmeniaArubaAustraliaAustriaAzerbaijanBahamas, TheBahrainBangladeshBarbadosBelarusBelgiumBelizeBeninBermudaBhutanBoliviaBosnia and HerzegovinaBotswanaBrazilBritish Virgin IslandsBrunei DarussalamBulgariaBurkina FasoBurundiCabo VerdeCambodiaCameroonCanadaCaribbean small statesCentral African RepublicCentral Europe and the BalticsChadChileChinaColombiaComorosCongo, Dem. Rep.Congo, Rep.Costa RicaCote d'IvoireCroatiaCubaCuracaoCyprusCzech RepublicDenmarkDjiboutiDominicaDominican RepublicEarly-demographic dividendEast Asia & PacificEast Asia & Pacific (excluding high income)East Asia & Pacific (IDA & IBRD countries)EcuadorEgypt, Arab Rep.El SalvadorEquatorial GuineaEritreaEstoniaEthiopiaEuro areaEurope & Central AsiaEurope & Central Asia (excluding high income)Europe & Central Asia (IDA & IBRD countries)European UnionFijiFinlandFragile and conflict affected situationsFranceGabonGambia, TheGeorgiaGermanyGhanaGreeceGrenadaGuatemalaGuineaGuinea-BissauGuyanaHaitiHeavily indebted poor countries (HIPC)High incomeHondurasHong Kong SAR, ChinaHungaryIBRD onlyIcelandIDA & IBRD totalIDA blendIDA onlyIDA totalIndiaIndonesiaIran, Islamic Rep.IraqIrelandIsraelItalyJamaicaJapanJordanKazakhstanKenyaKiribatiKorea, Dem. People’s Rep.Korea, Rep.KuwaitKyrgyz RepublicLao PDRLate-demographic dividendLatin America & Caribbean Latin America & Caribbean (excluding high income)Latin America & the Caribbean (IDA & IBRD countries)LatviaLeast developed countries: UN classificationLebanonLesothoLiberiaLibyaLiechtensteinLithuaniaLow & middle incomeLow incomeLower middle incomeLuxembourgMacao SAR, ChinaMacedonia, FYRMadagascarMalawiMalaysiaMaldivesMaliMaltaMarshall IslandsMauritaniaMauritiusMexicoMicronesia, Fed. Sts.Middle East & North AfricaMiddle East & North Africa (excluding high income)Middle East & North Africa (IDA & IBRD countries)Middle incomeMoldovaMongoliaMontenegroMoroccoMozambiqueMyanmarNamibiaNauruNepalNetherlandsNew ZealandNicaraguaNigerNigeriaNorth AmericaNorwayOECD membersOmanOther small statesPacific island small statesPakistanPalauPanamaPapua New GuineaParaguayPeruPhilippinesPolandPortugalPost-demographic dividendPre-demographic dividendPuerto RicoQatarRomaniaRussian FederationRwandaSamoaSan MarinoSao Tome and PrincipeSaudi ArabiaSenegalSerbiaSeychellesSierra LeoneSlovak RepublicSloveniaSmall statesSolomon IslandsSomaliaSouth AfricaSouth AsiaSouth Asia (IDA & IBRD)South SudanSpainSri LankaSt. Kitts and NevisSt. LuciaSt. Vincent and the GrenadinesSub-Saharan Africa Sub-Saharan Africa (excluding high income)Sub-Saharan Africa (IDA & IBRD countries)SudanSurinameSwazilandSwedenSwitzerlandSyrian Arab RepublicTajikistanTanzaniaThailandTimor-LesteTogoTongaTrinidad and TobagoTunisiaTurkeyTurkmenistanTuvaluUgandaUkraineUnited Arab EmiratesUnited KingdomUnited StatesUpper middle incomeUruguayUzbekistanVanuatuVenezuela, RBVietnamWest Bank and GazaWorldYemen, Rep.ZambiaZimbabwe línea de tiempo (timeline):
En esta escala de tiempo se presenta un gráfico de 1977 y 2015 de Vietnam. Los datos de 1976 están ausentes. El número de observaciones reales por fecha: 38.
Fuente (nombre):
Indicadores del desarrollo mundial
Fuente (organización):
UNESCO Institute for Statistics
Categorías:
Education
Se ha actualizado:
23 abr 2017 año
Los indicadores de los cambios de valor en los últimos años
Mínimo:
97.161
1 ene 2006 año
Máximo:
114.875
1 ene 1998 año
A la fecha de observación
Valor
Cambio absoluto
El cambio con respecto al valor anterior
1 ene 1977 año
109.942
+109.942
0.0%
1 ene 1978 año
113.067
+3.125
2.84%
1 ene 1979 año
112.139
-0.928
-0.82%
1 ene 1980 año
103.793
-8.346
-7.44%
1 ene 1981 año
109.97
+6.178
5.95%
1 ene 1982 año
107.523
-2.448
-2.23%
1 ene 1984 año
104.389
-3.134
-2.91%
1 ene 1985 año
104.739
+0.35
0.34%
1 ene 1986 año
104.058
-0.681
-0.65%
1 ene 1987 año
104.797
+0.738
0.71%
1 ene 1988 año
108.293
+3.496
3.34%
1 ene 1989 año
109.178
+0.885
0.82%
1 ene 1990 año
107.434
-1.744
-1.6%
1 ene 1991 año
104.561
-2.873
-2.67%
1 ene 1992 año
106.047
+1.486
1.42%
1 ene 1993 año
106.943
+0.896
0.84%
1 ene 1994 año
110.286
+3.343
3.13%
1 ene 1995 año
111.562
+1.276
1.16%
1 ene 1996 año
113.017
+1.455
1.3%
1 ene 1997 año
113.681
+0.664
0.59%
1 ene 1998 año
114.875
+1.194
1.05%
1 ene 1999 año
113.926
-0.949
-0.83%
1 ene 2000 año
111.106
-2.82
-2.48%
1 ene 2001 año
108.741
-2.365
-2.13%
1 ene 2002 año
105.808
-2.933
-2.7%
1 ene 2003 año
102.384
-3.424
-3.24%
1 ene 2004 año
99.576
-2.807
-2.74%
1 ene 2005 año
98.334
-1.243
-1.25%
1 ene 2006 año
97.161
-1.172
-1.19%
1 ene 2007 año
97.587
+0.426
0.44%
1 ene 2008 año
99.254
+1.666
1.71%
1 ene 2009 año
101.117
+1.864
1.88%
1 ene 2010 año
101.76
+0.643
0.64%
1 ene 2011 año
105.088
+3.328
3.27%
1 ene 2012 año
106.503
+1.416
1.35%
1 ene 2013 año
106.959
+0.455
0.43%
1 ene 2014 año
107.518
+0.559
0.52%
1 ene 2015 año
109.355
+1.837
1.71%
Ranking de los países por los datos estadísticos actuales


Comentarios: