29
/es/
es
AIzaSyAYiBZKx7MnpbEhh9jyipgxe19OcubqV5w
April 1, 2024
231095
Rwanda
RWA
true
2
1
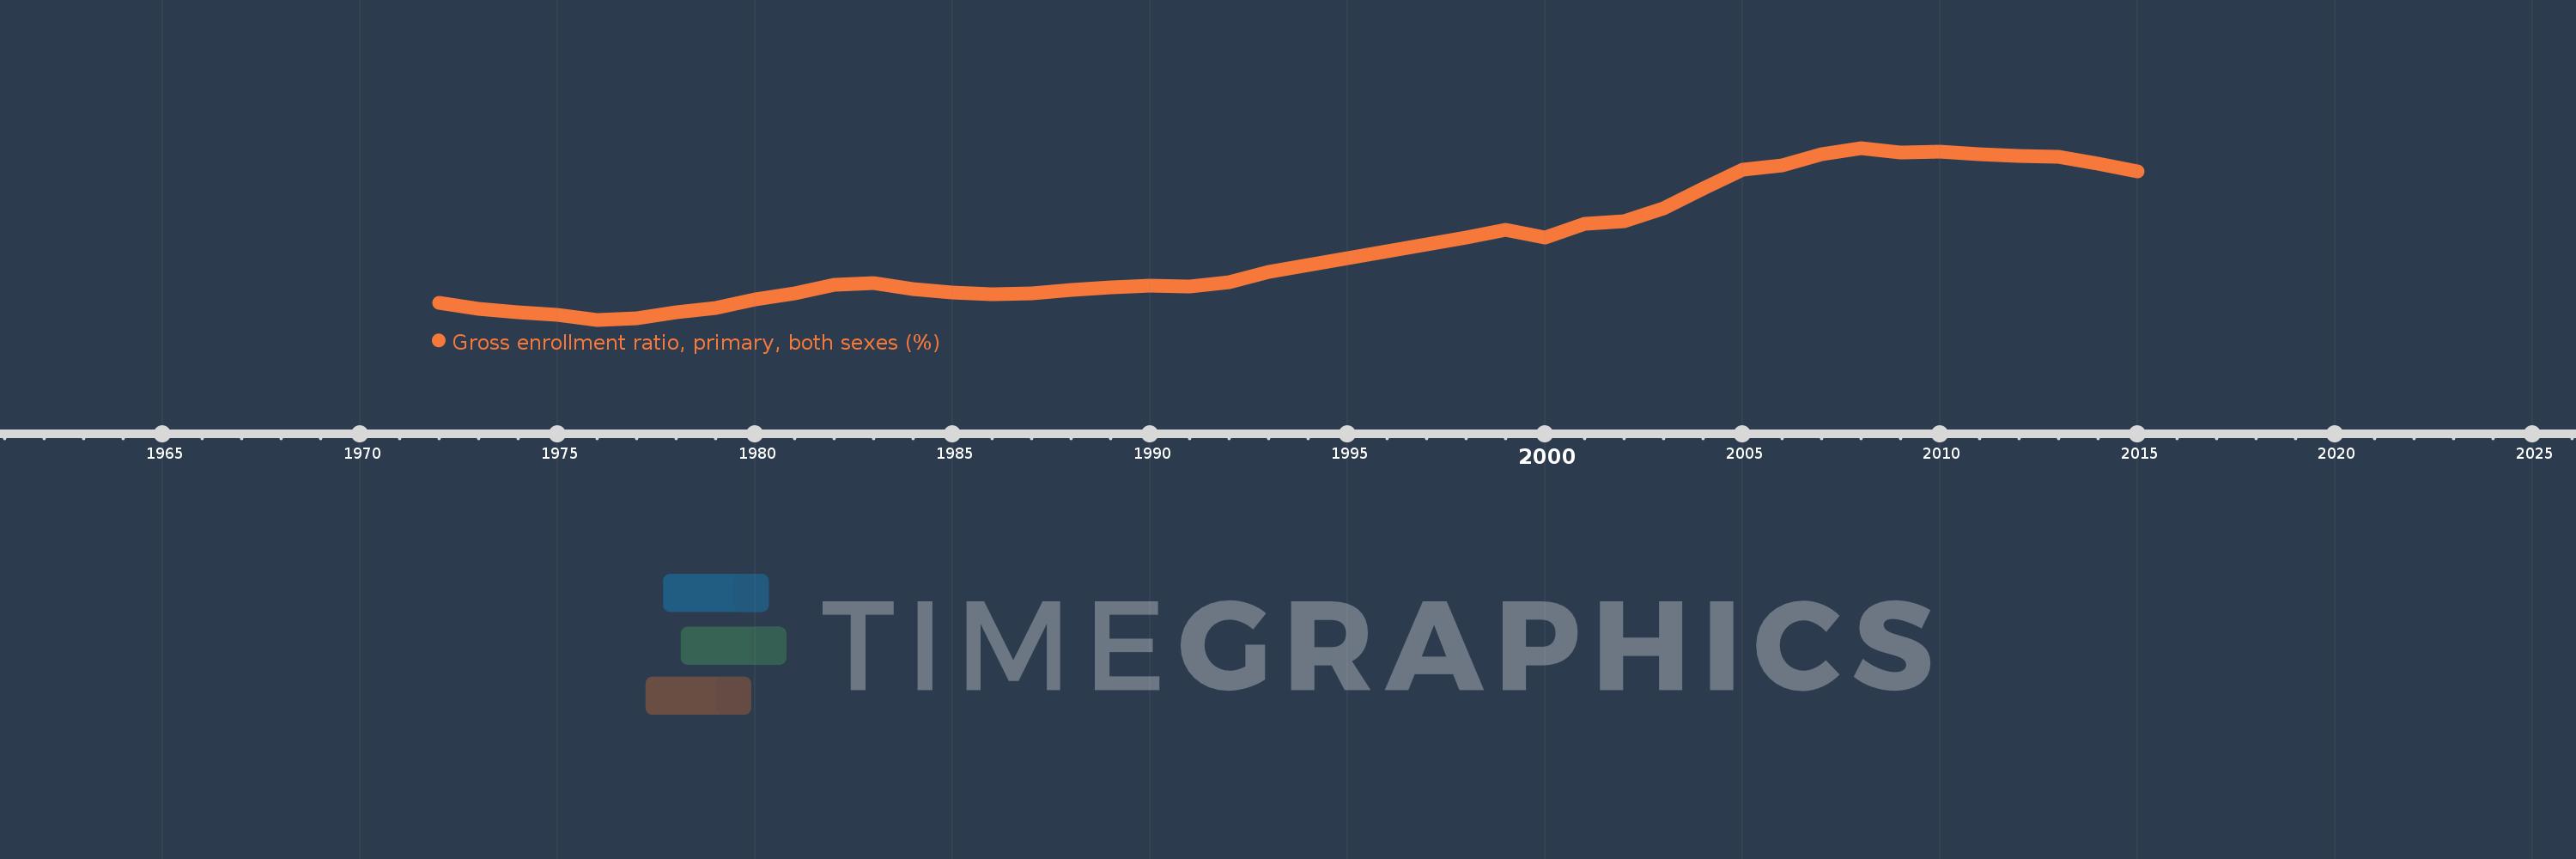
Gross enrollment ratio, primary, both sexes (%)
2015,2014,2013,2012,2011,2010,2009,2008,2007,2006,2005,2004,2003,2002,2001,2000,1999,1998,1993,1992,1991,1990,1989,1988,1987,1986,1985,1984,1983,1982,1981,1980,1979,1978,1977,1976,1975,1974,1973,1972
Estas estadísticas en otros países:
AfghanistanAlbaniaAlgeriaAndorraAngolaAntigua and BarbudaArab WorldArgentinaArmeniaArubaAustraliaAustriaAzerbaijanBahamas, TheBahrainBangladeshBarbadosBelarusBelgiumBelizeBeninBermudaBhutanBoliviaBosnia and HerzegovinaBotswanaBrazilBritish Virgin IslandsBrunei DarussalamBulgariaBurkina FasoBurundiCabo VerdeCambodiaCameroonCanadaCaribbean small statesCentral African RepublicCentral Europe and the BalticsChadChileChinaColombiaComorosCongo, Dem. Rep.Congo, Rep.Costa RicaCote d'IvoireCroatiaCubaCuracaoCyprusCzech RepublicDenmarkDjiboutiDominicaDominican RepublicEarly-demographic dividendEast Asia & PacificEast Asia & Pacific (excluding high income)East Asia & Pacific (IDA & IBRD countries)EcuadorEgypt, Arab Rep.El SalvadorEquatorial GuineaEritreaEstoniaEthiopiaEuro areaEurope & Central AsiaEurope & Central Asia (excluding high income)Europe & Central Asia (IDA & IBRD countries)European UnionFijiFinlandFragile and conflict affected situationsFranceGabonGambia, TheGeorgiaGermanyGhanaGreeceGrenadaGuatemalaGuineaGuinea-BissauGuyanaHaitiHeavily indebted poor countries (HIPC)High incomeHondurasHong Kong SAR, ChinaHungaryIBRD onlyIcelandIDA & IBRD totalIDA blendIDA onlyIDA totalIndiaIndonesiaIran, Islamic Rep.IraqIrelandIsraelItalyJamaicaJapanJordanKazakhstanKenyaKiribatiKorea, Dem. People’s Rep.Korea, Rep.KuwaitKyrgyz RepublicLao PDRLate-demographic dividendLatin America & Caribbean Latin America & Caribbean (excluding high income)Latin America & the Caribbean (IDA & IBRD countries)LatviaLeast developed countries: UN classificationLebanonLesothoLiberiaLibyaLiechtensteinLithuaniaLow & middle incomeLow incomeLower middle incomeLuxembourgMacao SAR, ChinaMacedonia, FYRMadagascarMalawiMalaysiaMaldivesMaliMaltaMarshall IslandsMauritaniaMauritiusMexicoMicronesia, Fed. Sts.Middle East & North AfricaMiddle East & North Africa (excluding high income)Middle East & North Africa (IDA & IBRD countries)Middle incomeMoldovaMongoliaMontenegroMoroccoMozambiqueMyanmarNamibiaNauruNepalNetherlandsNew ZealandNicaraguaNigerNigeriaNorth AmericaNorwayOECD membersOmanOther small statesPacific island small statesPakistanPalauPanamaPapua New GuineaParaguayPeruPhilippinesPolandPortugalPost-demographic dividendPre-demographic dividendPuerto RicoQatarRomaniaRussian FederationRwandaSamoaSan MarinoSao Tome and PrincipeSaudi ArabiaSenegalSerbiaSeychellesSierra LeoneSlovak RepublicSloveniaSmall statesSolomon IslandsSomaliaSouth AfricaSouth AsiaSouth Asia (IDA & IBRD)South SudanSpainSri LankaSt. Kitts and NevisSt. LuciaSt. Vincent and the GrenadinesSub-Saharan Africa Sub-Saharan Africa (excluding high income)Sub-Saharan Africa (IDA & IBRD countries)SudanSurinameSwazilandSwedenSwitzerlandSyrian Arab RepublicTajikistanTanzaniaThailandTimor-LesteTogoTongaTrinidad and TobagoTunisiaTurkeyTurkmenistanTuvaluUgandaUkraineUnited Arab EmiratesUnited KingdomUnited StatesUpper middle incomeUruguayUzbekistanVanuatuVenezuela, RBVietnamWest Bank and GazaWorldYemen, Rep.ZambiaZimbabwe línea de tiempo (timeline):
En esta escala de tiempo se presenta un gráfico de 1972 y 2015 de Rwanda. Los datos de 1971 están ausentes. El número de observaciones reales por fecha: 40.
Fuente (nombre):
Indicadores del desarrollo mundial
Fuente (organización):
UNESCO Institute for Statistics
Categorías:
Education
Se ha actualizado:
23 abr 2017 año
Los indicadores de los cambios de valor en los últimos años
Mínimo:
55.616
1 ene 1976 año
Máximo:
145.851
1 ene 2008 año
A la fecha de observación
Valor
Cambio absoluto
El cambio con respecto al valor anterior
1 ene 1972 año
64.66
+64.66
0.0%
1 ene 1973 año
61.474
-3.186
-4.93%
1 ene 1974 año
59.732
-1.742
-2.83%
1 ene 1975 año
58.367
-1.365
-2.29%
1 ene 1976 año
55.616
-2.751
-4.71%
1 ene 1977 año
56.582
+0.966
1.74%
1 ene 1978 año
59.62
+3.038
5.37%
1 ene 1979 año
61.734
+2.114
3.55%
1 ene 1980 año
66.426
+4.692
7.6%
1 ene 1981 año
69.553
+3.127
4.71%
1 ene 1982 año
73.899
+4.346
6.25%
1 ene 1983 año
74.781
+0.882
1.19%
1 ene 1984 año
71.552
-3.228
-4.32%
1 ene 1985 año
69.901
-1.651
-2.31%
1 ene 1986 año
68.966
-0.935
-1.34%
1 ene 1987 año
69.543
+0.577
0.84%
1 ene 1988 año
71.295
+1.753
2.52%
1 ene 1989 año
72.477
+1.181
1.66%
1 ene 1990 año
73.409
+0.933
1.29%
1 ene 1991 año
73.106
-0.303
-0.41%
1 ene 1992 año
75.174
+2.068
2.83%
1 ene 1993 año
80.703
+5.529
7.35%
1 ene 1998 año
98.573
+17.87
22.14%
1 ene 1999 año
102.848
+4.274
4.34%
1 ene 2000 año
99.003
-3.844
-3.74%
1 ene 2001 año
105.989
+6.986
7.06%
1 ene 2002 año
107.36
+1.371
1.29%
1 ene 2003 año
114.211
+6.851
6.38%
1 ene 2004 año
124.5
+10.289
9.01%
1 ene 2005 año
134.326
+9.826
7.89%
1 ene 2006 año
136.598
+2.272
1.69%
1 ene 2007 año
142.715
+6.117
4.48%
1 ene 2008 año
145.851
+3.136
2.2%
1 ene 2009 año
143.384
-2.467
-1.69%
1 ene 2010 año
143.793
+0.409
0.28%
1 ene 2011 año
142.341
-1.452
-1.01%
1 ene 2012 año
141.691
-0.65
-0.46%
1 ene 2013 año
141.301
-0.39
-0.28%
1 ene 2014 año
137.743
-3.558
-2.52%
1 ene 2015 año
133.582
-4.161
-3.02%
Ranking de los países por los datos estadísticos actuales


Comentarios: