29
/es/
es
AIzaSyAYiBZKx7MnpbEhh9jyipgxe19OcubqV5w
April 1, 2024
24139
Arab World
ARB
false
2
1
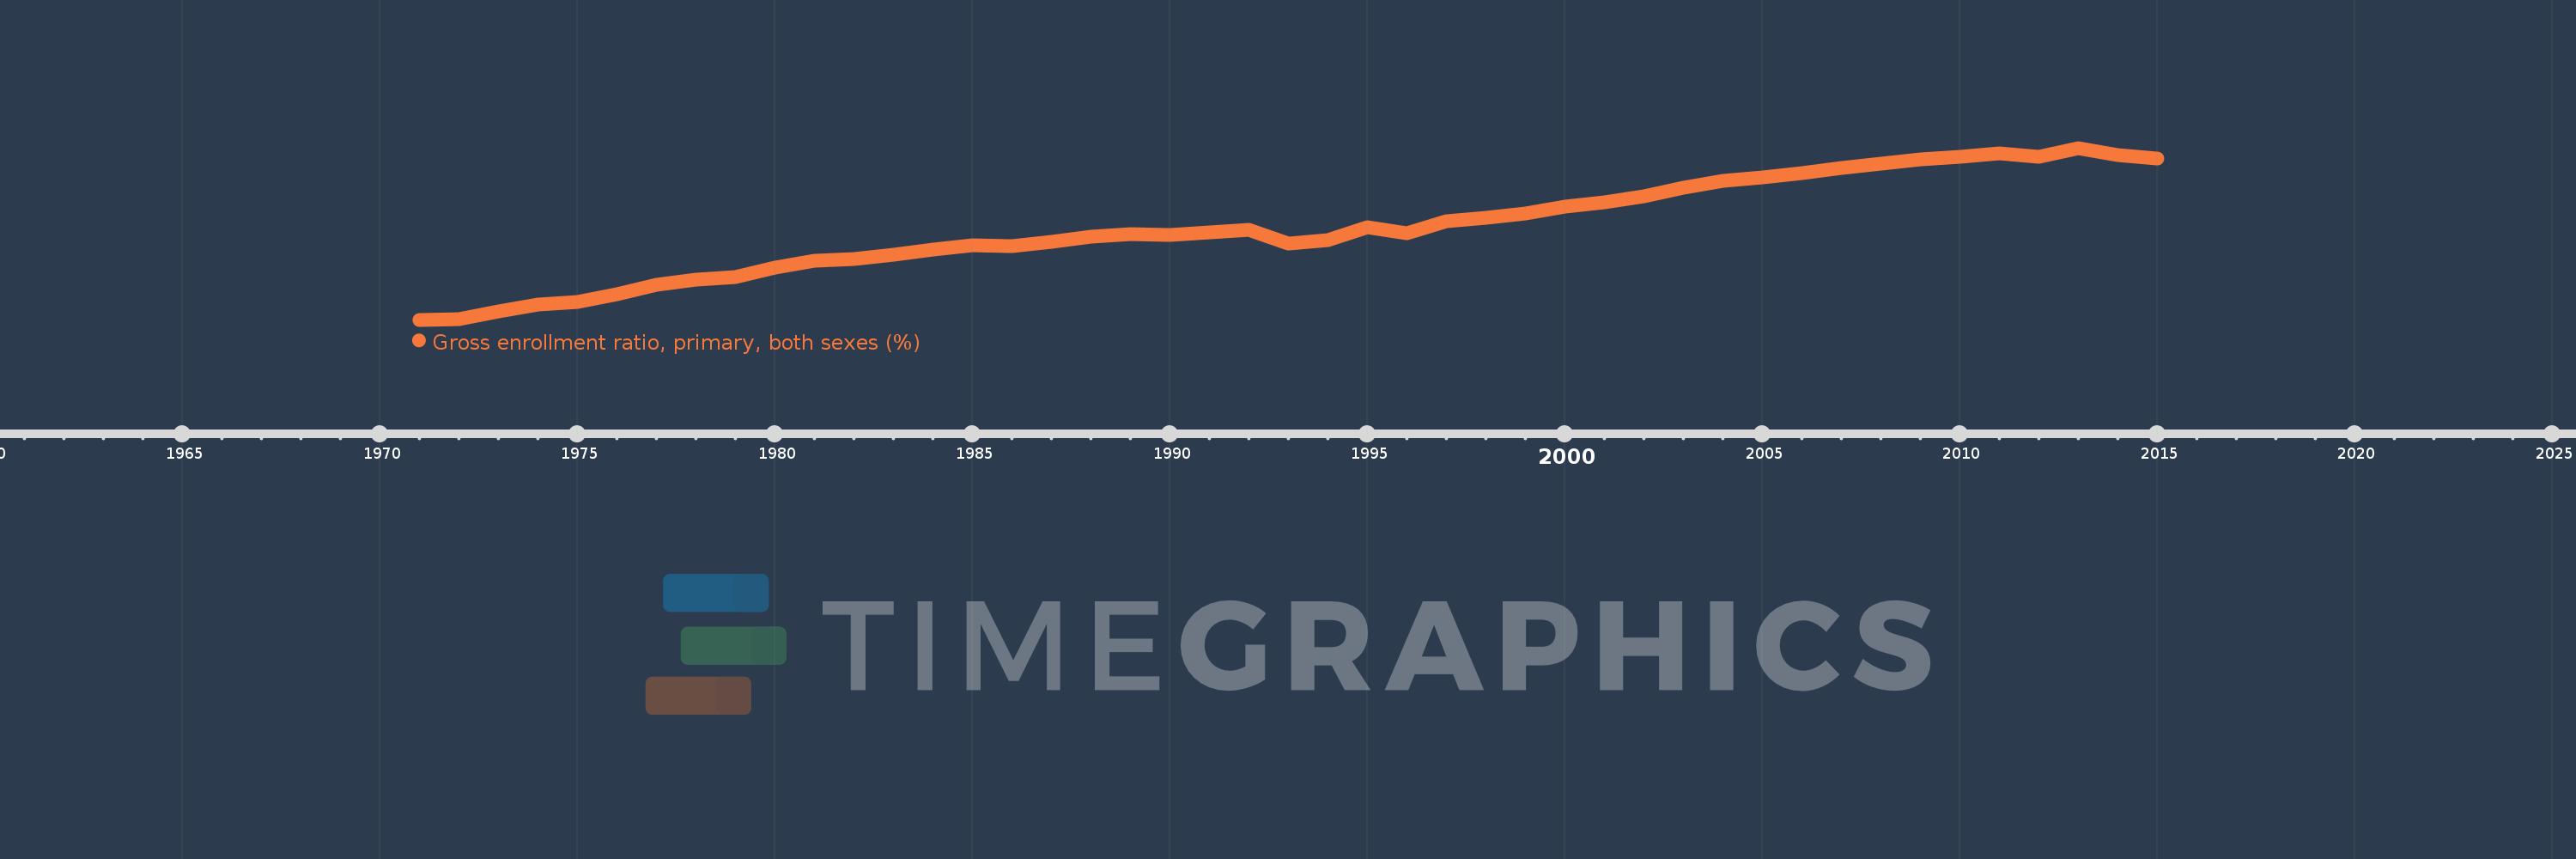
Gross enrollment ratio, primary, both sexes (%)
2015,2014,2013,2012,2011,2010,2009,2008,2007,2006,2005,2004,2003,2002,2001,2000,1999,1998,1997,1996,1995,1994,1993,1992,1991,1990,1989,1988,1987,1986,1985,1984,1983,1982,1981,1980,1979,1978,1977,1976,1975,1974,1973,1972,1971
Estas estadísticas en otros países:
AfghanistanAlbaniaAlgeriaAndorraAngolaAntigua and BarbudaArab WorldArgentinaArmeniaArubaAustraliaAustriaAzerbaijanBahamas, TheBahrainBangladeshBarbadosBelarusBelgiumBelizeBeninBermudaBhutanBoliviaBosnia and HerzegovinaBotswanaBrazilBritish Virgin IslandsBrunei DarussalamBulgariaBurkina FasoBurundiCabo VerdeCambodiaCameroonCanadaCaribbean small statesCentral African RepublicCentral Europe and the BalticsChadChileChinaColombiaComorosCongo, Dem. Rep.Congo, Rep.Costa RicaCote d'IvoireCroatiaCubaCuracaoCyprusCzech RepublicDenmarkDjiboutiDominicaDominican RepublicEarly-demographic dividendEast Asia & PacificEast Asia & Pacific (excluding high income)East Asia & Pacific (IDA & IBRD countries)EcuadorEgypt, Arab Rep.El SalvadorEquatorial GuineaEritreaEstoniaEthiopiaEuro areaEurope & Central AsiaEurope & Central Asia (excluding high income)Europe & Central Asia (IDA & IBRD countries)European UnionFijiFinlandFragile and conflict affected situationsFranceGabonGambia, TheGeorgiaGermanyGhanaGreeceGrenadaGuatemalaGuineaGuinea-BissauGuyanaHaitiHeavily indebted poor countries (HIPC)High incomeHondurasHong Kong SAR, ChinaHungaryIBRD onlyIcelandIDA & IBRD totalIDA blendIDA onlyIDA totalIndiaIndonesiaIran, Islamic Rep.IraqIrelandIsraelItalyJamaicaJapanJordanKazakhstanKenyaKiribatiKorea, Dem. People’s Rep.Korea, Rep.KuwaitKyrgyz RepublicLao PDRLate-demographic dividendLatin America & Caribbean Latin America & Caribbean (excluding high income)Latin America & the Caribbean (IDA & IBRD countries)LatviaLeast developed countries: UN classificationLebanonLesothoLiberiaLibyaLiechtensteinLithuaniaLow & middle incomeLow incomeLower middle incomeLuxembourgMacao SAR, ChinaMacedonia, FYRMadagascarMalawiMalaysiaMaldivesMaliMaltaMarshall IslandsMauritaniaMauritiusMexicoMicronesia, Fed. Sts.Middle East & North AfricaMiddle East & North Africa (excluding high income)Middle East & North Africa (IDA & IBRD countries)Middle incomeMoldovaMongoliaMontenegroMoroccoMozambiqueMyanmarNamibiaNauruNepalNetherlandsNew ZealandNicaraguaNigerNigeriaNorth AmericaNorwayOECD membersOmanOther small statesPacific island small statesPakistanPalauPanamaPapua New GuineaParaguayPeruPhilippinesPolandPortugalPost-demographic dividendPre-demographic dividendPuerto RicoQatarRomaniaRussian FederationRwandaSamoaSan MarinoSao Tome and PrincipeSaudi ArabiaSenegalSerbiaSeychellesSierra LeoneSlovak RepublicSloveniaSmall statesSolomon IslandsSomaliaSouth AfricaSouth AsiaSouth Asia (IDA & IBRD)South SudanSpainSri LankaSt. Kitts and NevisSt. LuciaSt. Vincent and the GrenadinesSub-Saharan Africa Sub-Saharan Africa (excluding high income)Sub-Saharan Africa (IDA & IBRD countries)SudanSurinameSwazilandSwedenSwitzerlandSyrian Arab RepublicTajikistanTanzaniaThailandTimor-LesteTogoTongaTrinidad and TobagoTunisiaTurkeyTurkmenistanTuvaluUgandaUkraineUnited Arab EmiratesUnited KingdomUnited StatesUpper middle incomeUruguayUzbekistanVanuatuVenezuela, RBVietnamWest Bank and GazaWorldYemen, Rep.ZambiaZimbabwe línea de tiempo (timeline):
En esta escala de tiempo se presenta un gráfico de 1971 y 2015 de Arab World. Los datos de 1970 están ausentes. El número de observaciones reales por fecha: 45.
Fuente (nombre):
Indicadores del desarrollo mundial
Fuente (organización):
UNESCO Institute for Statistics
Categorías:
Education
Se ha actualizado:
23 abr 2017 año
Los indicadores de los cambios de valor en los últimos años
Mínimo:
66.622
1 ene 1971 año
Máximo:
99.02
1 ene 2013 año
A la fecha de observación
Valor
Cambio absoluto
El cambio con respecto al valor anterior
1 ene 1971 año
66.622
+66.622
0.0%
1 ene 1972 año
66.721
+0.099
0.15%
1 ene 1973 año
68.259
+1.538
2.31%
1 ene 1974 año
69.522
+1.263
1.85%
1 ene 1975 año
69.92
+0.398
0.57%
1 ene 1976 año
71.355
+1.435
2.05%
1 ene 1977 año
73.227
+1.872
2.62%
1 ene 1978 año
74.204
+0.977
1.33%
1 ene 1979 año
74.603
+0.399
0.54%
1 ene 1980 año
76.482
+1.879
2.52%
1 ene 1981 año
77.782
+1.3
1.7%
1 ene 1982 año
78.039
+0.258
0.33%
1 ene 1983 año
78.948
+0.908
1.16%
1 ene 1984 año
79.806
+0.858
1.09%
1 ene 1985 año
80.715
+0.909
1.14%
1 ene 1986 año
80.569
-0.146
-0.18%
1 ene 1987 año
81.293
+0.724
0.9%
1 ene 1988 año
82.286
+0.994
1.22%
1 ene 1989 año
82.818
+0.531
0.65%
1 ene 1990 año
82.536
-0.282
-0.34%
1 ene 1991 año
83.147
+0.611
0.74%
1 ene 1992 año
83.595
+0.448
0.54%
1 ene 1993 año
81.016
-2.579
-3.08%
1 ene 1994 año
81.591
+0.575
0.71%
1 ene 1995 año
84.134
+2.543
3.12%
1 ene 1996 año
82.933
-1.202
-1.43%
1 ene 1997 año
85.225
+2.292
2.76%
1 ene 1998 año
85.92
+0.695
0.82%
1 ene 1999 año
86.656
+0.736
0.86%
1 ene 2000 año
87.916
+1.26
1.45%
1 ene 2001 año
88.839
+0.923
1.05%
1 ene 2002 año
89.973
+1.134
1.28%
1 ene 2003 año
91.469
+1.495
1.66%
1 ene 2004 año
92.771
+1.302
1.42%
1 ene 2005 año
93.453
+0.682
0.73%
1 ene 2006 año
94.205
+0.752
0.81%
1 ene 2007 año
95.321
+1.116
1.18%
1 ene 2008 año
96.004
+0.683
0.72%
1 ene 2009 año
96.857
+0.853
0.89%
1 ene 2010 año
97.337
+0.481
0.5%
1 ene 2011 año
97.973
+0.635
0.65%
1 ene 2012 año
97.424
-0.548
-0.56%
1 ene 2013 año
99.02
+1.596
1.64%
1 ene 2014 año
97.601
-1.419
-1.43%
1 ene 2015 año
97.027
-0.574
-0.59%
Ranking de los países por los datos estadísticos actuales


Comentarios: