29
/es/
es
AIzaSyAYiBZKx7MnpbEhh9jyipgxe19OcubqV5w
April 1, 2024
277926
Uruguay
URY
true
2
1
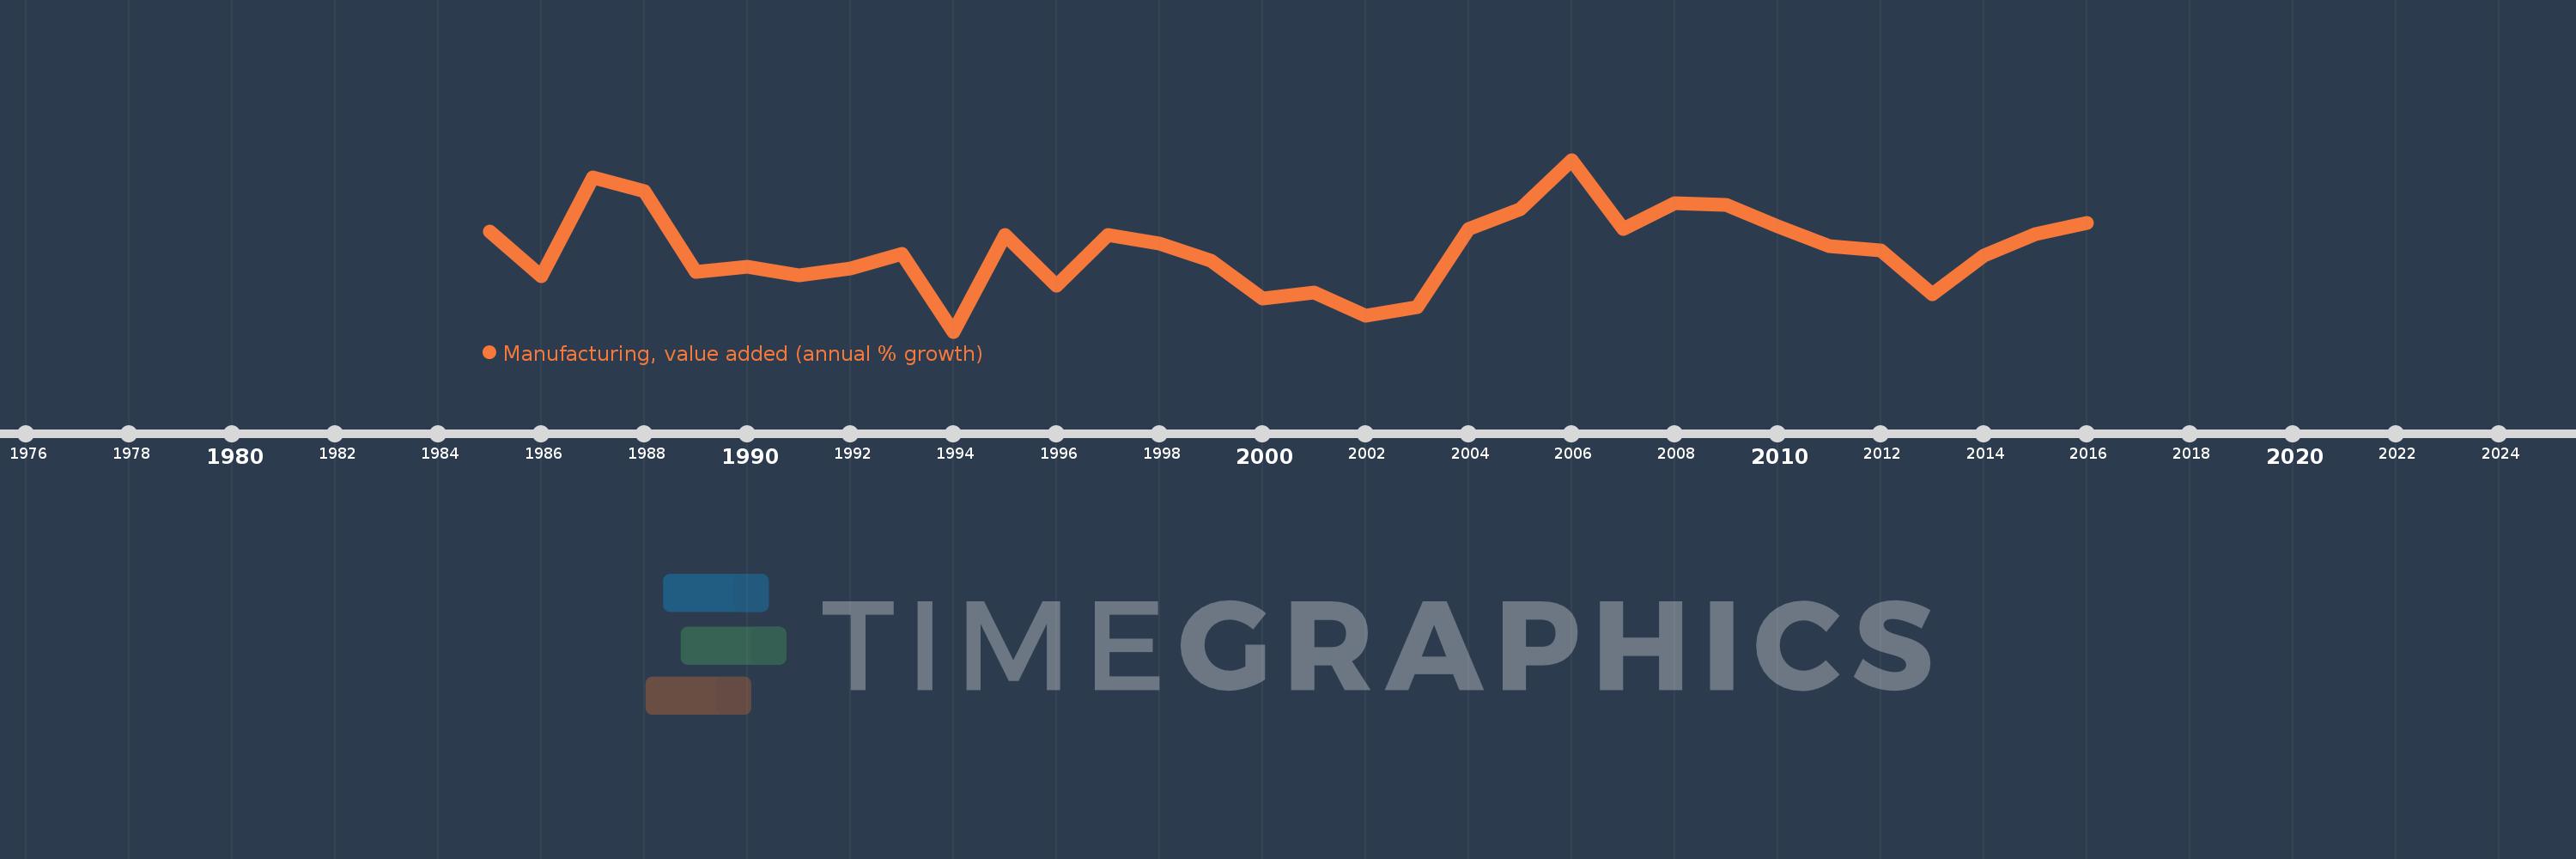
Manufacturing, value added (annual % growth)
2016,2015,2014,2013,2012,2011,2010,2009,2008,2007,2006,2005,2004,2003,2002,2001,2000,1999,1998,1997,1996,1995,1994,1993,1992,1991,1990,1989,1988,1987,1986,1985
Estas estadísticas en otros países:
AfghanistanAlbaniaAlgeriaAntigua and BarbudaArab WorldArgentinaArmeniaAustraliaAustriaAzerbaijanBahamas, TheBahrainBangladeshBelarusBelgiumBelizeBeninBermudaBhutanBoliviaBosnia and HerzegovinaBotswanaBrazilBrunei DarussalamBurkina FasoBurundiCabo VerdeCambodiaCameroonCanadaCaribbean small statesCayman IslandsCentral African RepublicCentral Europe and the BalticsChadChileColombiaComorosCongo, Dem. Rep.Congo, Rep.Costa RicaCote d'IvoireCroatiaCubaCyprusCzech RepublicDenmarkDjiboutiDominicaDominican RepublicEarly-demographic dividendEcuadorEgypt, Arab Rep.El SalvadorEquatorial GuineaEritreaEstoniaEthiopiaEuro areaEurope & Central AsiaEurope & Central Asia (excluding high income)Europe & Central Asia (IDA & IBRD countries)European UnionFijiFinlandFragile and conflict affected situationsFranceGabonGambia, TheGeorgiaGermanyGhanaGreeceGrenadaGuatemalaGuineaGuyanaHaitiHeavily indebted poor countries (HIPC)High incomeHondurasHong Kong SAR, ChinaHungaryIcelandIDA blendIDA onlyIDA totalIndiaIndonesiaIran, Islamic Rep.IraqIrelandItalyJamaicaJapanJordanKazakhstanKenyaKiribatiKorea, Rep.KosovoKuwaitKyrgyz RepublicLao PDRLatin America & Caribbean Latin America & Caribbean (excluding high income)Latin America & the Caribbean (IDA & IBRD countries)LatviaLeast developed countries: UN classificationLebanonLesothoLiberiaLithuaniaLow incomeLower middle incomeLuxembourgMacedonia, FYRMadagascarMalawiMalaysiaMaldivesMarshall IslandsMauritaniaMauritiusMexicoMicronesia, Fed. Sts.Middle East & North AfricaMiddle East & North Africa (excluding high income)Middle East & North Africa (IDA & IBRD countries)MoldovaMongoliaMontenegroMoroccoMozambiqueMyanmarNamibiaNepalNetherlandsNew ZealandNicaraguaNigerNigeriaNorth AmericaNorwayOECD membersOmanOther small statesPacific island small statesPakistanPalauPanamaPapua New GuineaParaguayPeruPhilippinesPolandPortugalPost-demographic dividendPre-demographic dividendPuerto RicoQatarRomaniaRussian FederationRwandaSamoaSao Tome and PrincipeSaudi ArabiaSenegalSerbiaSeychellesSierra LeoneSingaporeSlovak RepublicSloveniaSmall statesSolomon IslandsSomaliaSouth AfricaSouth AsiaSouth Asia (IDA & IBRD)SpainSri LankaSt. Kitts and NevisSt. LuciaSt. Vincent and the GrenadinesSub-Saharan Africa Sub-Saharan Africa (excluding high income)Sub-Saharan Africa (IDA & IBRD countries)SudanSurinameSwazilandSwedenSwitzerlandSyrian Arab RepublicTajikistanTanzaniaThailandTimor-LesteTogoTongaTrinidad and TobagoTunisiaTurkeyTuvaluUgandaUkraineUnited Arab EmiratesUnited KingdomUnited StatesUruguayUzbekistanVanuatuVenezuela, RBVietnamWest Bank and GazaWorldZambiaZimbabwe línea de tiempo (timeline):
En esta escala de tiempo se presenta un gráfico de 1985 y 2016 de Uruguay. Los datos de 1984 están ausentes. El número de observaciones reales por fecha: 32.
Fuente (nombre):
Indicadores del desarrollo mundial
Fuente (organización):
World Bank national accounts data, and OECD National Accounts data files.
Categorías:
Economy & Growth
Se ha actualizado:
23 abr 2017 año
Los indicadores de los cambios de valor en los últimos años
Mínimo:
-8.984
1 ene 1994 año
Máximo:
14.155
1 ene 2006 año
A la fecha de observación
Valor
Cambio absoluto
El cambio con respecto al valor anterior
1 ene 1985 año
4.479
+4.479
0.0%
1 ene 1986 año
-1.562
-6.041
-134.88%
1 ene 1987 año
11.736
+13.298
-851.13%
1 ene 1988 año
9.963
-1.773
-15.1%
1 ene 1989 año
-0.948
-10.912
-109.52%
1 ene 1990 año
-0.192
+0.756
-79.73%
1 ene 1991 año
-1.458
-1.266
658.47%
1 ene 1992 año
-0.522
+0.936
-64.17%
1 ene 1993 año
1.528
+2.05
-392.44%
1 ene 1994 año
-8.984
-10.512
-688.13%
1 ene 1995 año
4.04
+13.024
-144.96%
1 ene 1996 año
-2.834
-6.874
-170.16%
1 ene 1997 año
4.012
+6.846
-241.55%
1 ene 1998 año
2.927
-1.084
-27.03%
1 ene 1999 año
0.532
-2.395
-81.82%
1 ene 2000 año
-4.577
-5.11
-959.88%
1 ene 2001 año
-3.667
+0.911
-19.9%
1 ene 2002 año
-6.787
-3.121
85.11%
1 ene 2003 año
-5.687
+1.101
-16.22%
1 ene 2004 año
4.88
+10.567
-185.82%
1 ene 2005 año
7.48
+2.6
53.26%
1 ene 2006 año
14.155
+6.675
89.24%
1 ene 2007 año
4.797
-9.358
-66.11%
1 ene 2008 año
8.304
+3.507
73.11%
1 ene 2009 año
8.136
-0.167
-2.01%
1 ene 2010 año
5.242
-2.895
-35.58%
1 ene 2011 año
2.558
-2.683
-51.19%
1 ene 2012 año
1.977
-0.581
-22.72%
1 ene 2013 año
-3.95
-5.927
-299.79%
1 ene 2014 año
1.198
+5.148
-130.33%
1 ene 2015 año
4.185
+2.987
249.29%
1 ene 2016 año
5.689
+1.504
35.95%
Ranking de los países por los datos estadísticos actuales


Comentarios: