29
/es/
es
AIzaSyAYiBZKx7MnpbEhh9jyipgxe19OcubqV5w
April 1, 2024
216695
Pakistan
PAK
true
2
1
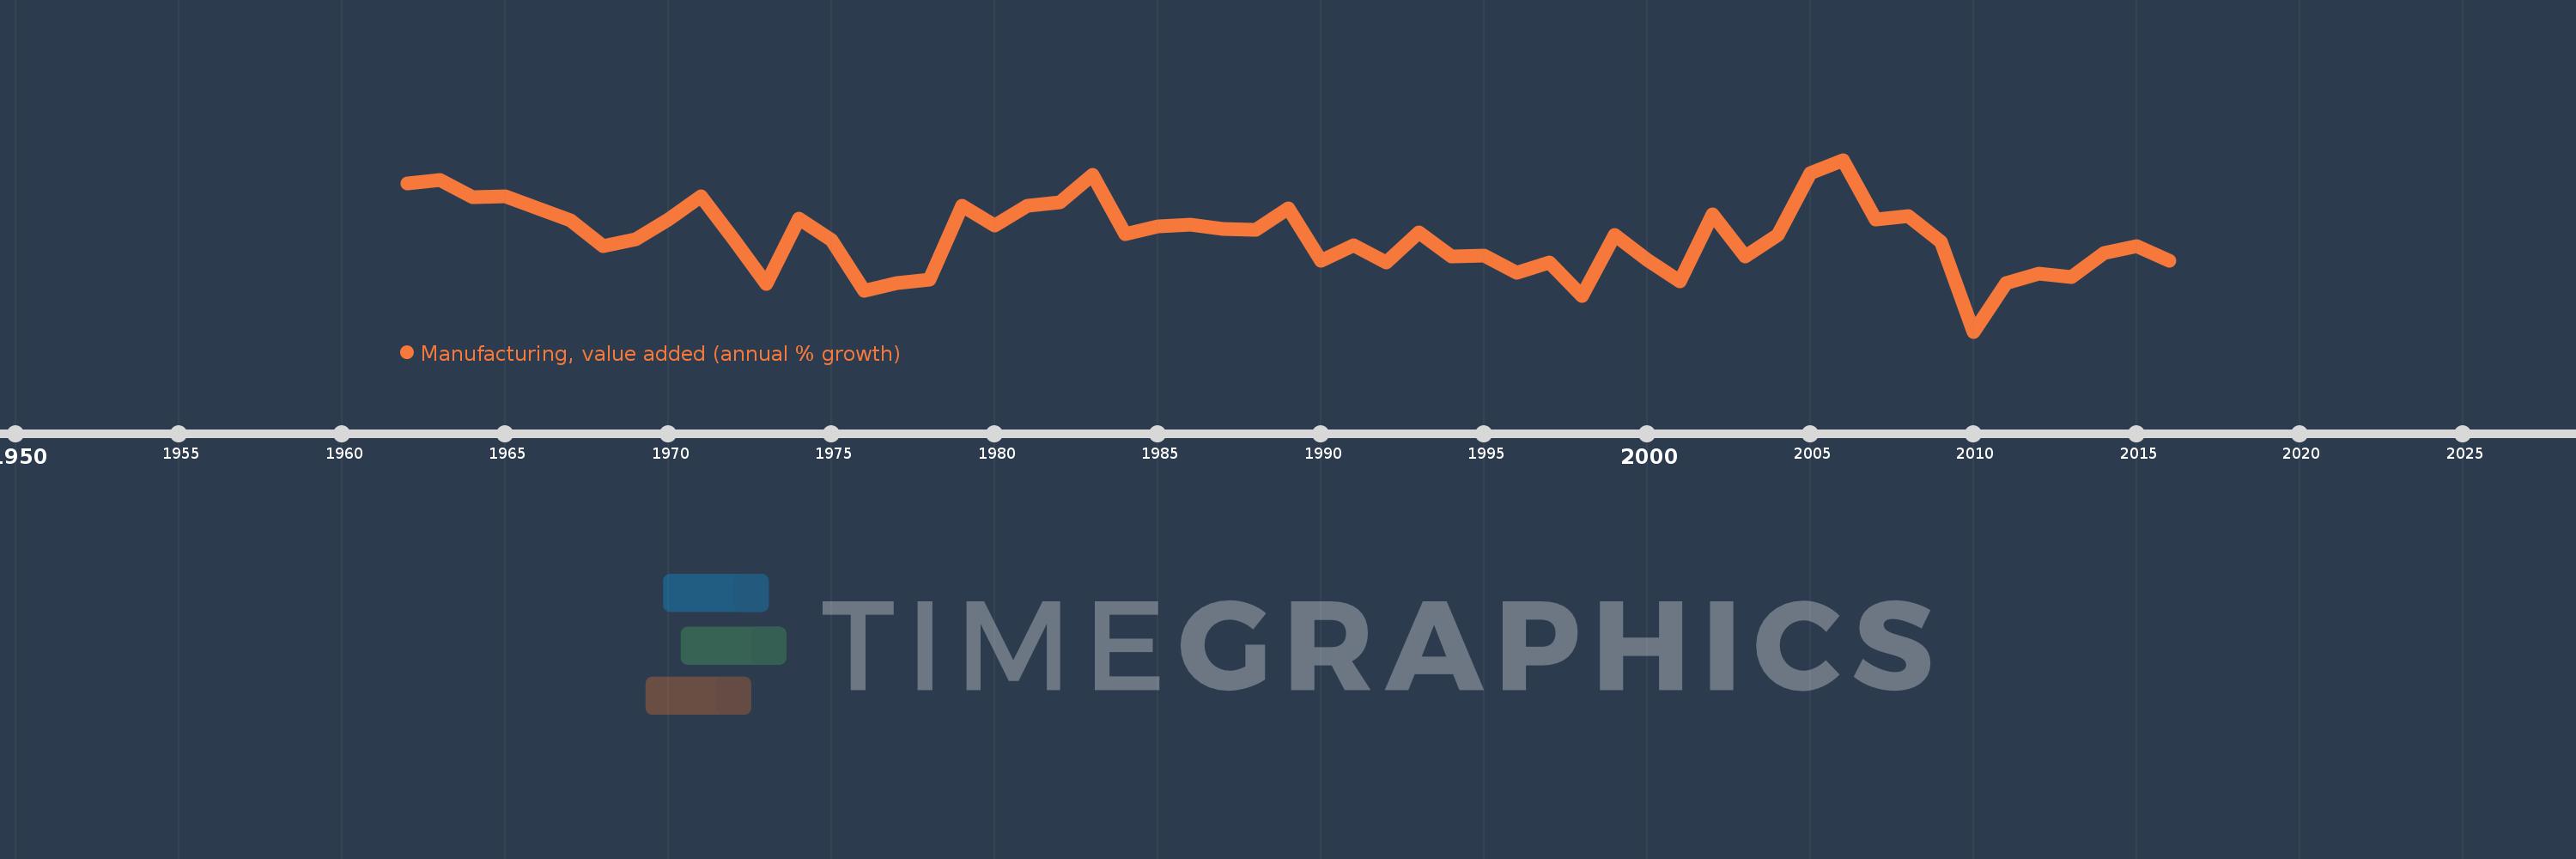
Manufacturing, value added (annual % growth)
2016,2015,2014,2013,2012,2011,2010,2009,2008,2007,2006,2005,2004,2003,2002,2001,2000,1999,1998,1997,1996,1995,1994,1993,1992,1991,1990,1989,1988,1987,1986,1985,1984,1983,1982,1981,1980,1979,1978,1977,1976,1975,1974,1973,1972,1971,1970,1969,1968,1967,1966,1965,1964,1963,1962
Estas estadísticas en otros países:
AfghanistanAlbaniaAlgeriaAntigua and BarbudaArab WorldArgentinaArmeniaAustraliaAustriaAzerbaijanBahamas, TheBahrainBangladeshBelarusBelgiumBelizeBeninBermudaBhutanBoliviaBosnia and HerzegovinaBotswanaBrazilBrunei DarussalamBurkina FasoBurundiCabo VerdeCambodiaCameroonCanadaCaribbean small statesCayman IslandsCentral African RepublicCentral Europe and the BalticsChadChileColombiaComorosCongo, Dem. Rep.Congo, Rep.Costa RicaCote d'IvoireCroatiaCubaCyprusCzech RepublicDenmarkDjiboutiDominicaDominican RepublicEarly-demographic dividendEcuadorEgypt, Arab Rep.El SalvadorEquatorial GuineaEritreaEstoniaEthiopiaEuro areaEurope & Central AsiaEurope & Central Asia (excluding high income)Europe & Central Asia (IDA & IBRD countries)European UnionFijiFinlandFragile and conflict affected situationsFranceGabonGambia, TheGeorgiaGermanyGhanaGreeceGrenadaGuatemalaGuineaGuyanaHaitiHeavily indebted poor countries (HIPC)High incomeHondurasHong Kong SAR, ChinaHungaryIcelandIDA blendIDA onlyIDA totalIndiaIndonesiaIran, Islamic Rep.IraqIrelandItalyJamaicaJapanJordanKazakhstanKenyaKiribatiKorea, Rep.KosovoKuwaitKyrgyz RepublicLao PDRLatin America & Caribbean Latin America & Caribbean (excluding high income)Latin America & the Caribbean (IDA & IBRD countries)LatviaLeast developed countries: UN classificationLebanonLesothoLiberiaLithuaniaLow incomeLower middle incomeLuxembourgMacedonia, FYRMadagascarMalawiMalaysiaMaldivesMarshall IslandsMauritaniaMauritiusMexicoMicronesia, Fed. Sts.Middle East & North AfricaMiddle East & North Africa (excluding high income)Middle East & North Africa (IDA & IBRD countries)MoldovaMongoliaMontenegroMoroccoMozambiqueMyanmarNamibiaNepalNetherlandsNew ZealandNicaraguaNigerNigeriaNorth AmericaNorwayOECD membersOmanOther small statesPacific island small statesPakistanPalauPanamaPapua New GuineaParaguayPeruPhilippinesPolandPortugalPost-demographic dividendPre-demographic dividendPuerto RicoQatarRomaniaRussian FederationRwandaSamoaSao Tome and PrincipeSaudi ArabiaSenegalSerbiaSeychellesSierra LeoneSingaporeSlovak RepublicSloveniaSmall statesSolomon IslandsSomaliaSouth AfricaSouth AsiaSouth Asia (IDA & IBRD)SpainSri LankaSt. Kitts and NevisSt. LuciaSt. Vincent and the GrenadinesSub-Saharan Africa Sub-Saharan Africa (excluding high income)Sub-Saharan Africa (IDA & IBRD countries)SudanSurinameSwazilandSwedenSwitzerlandSyrian Arab RepublicTajikistanTanzaniaThailandTimor-LesteTogoTongaTrinidad and TobagoTunisiaTurkeyTuvaluUgandaUkraineUnited Arab EmiratesUnited KingdomUnited StatesUruguayUzbekistanVanuatuVenezuela, RBVietnamWest Bank and GazaWorldZambiaZimbabwe línea de tiempo (timeline):
En esta escala de tiempo se presenta un gráfico de 1962 y 2016 de Pakistan. Los datos de 1961 están ausentes. El número de observaciones reales por fecha: 55.
Fuente (nombre):
Indicadores del desarrollo mundial
Fuente (organización):
World Bank national accounts data, and OECD National Accounts data files.
Categorías:
Economy & Growth
Se ha actualizado:
23 abr 2017 año
Los indicadores de los cambios de valor en los últimos años
Mínimo:
-4.176
1 ene 2010 año
Máximo:
15.507
1 ene 2006 año
A la fecha de observación
Valor
Cambio absoluto
El cambio con respecto al valor anterior
1 ene 1962 año
12.778
+12.778
0.0%
1 ene 1963 año
13.177
+0.398
3.12%
1 ene 1964 año
11.204
-1.972
-14.97%
1 ene 1965 año
11.366
+0.162
1.45%
1 ene 1966 año
9.928
-1.438
-12.66%
1 ene 1967 año
8.594
-1.334
-13.43%
1 ene 1968 año
5.66
-2.934
-34.14%
1 ene 1969 año
6.374
+0.714
12.61%
1 ene 1970 año
8.627
+2.253
35.34%
1 ene 1971 año
11.333
+2.706
31.37%
1 ene 1972 año
6.439
-4.894
-43.18%
1 ene 1973 año
1.25
-5.189
-80.59%
1 ene 1974 año
8.73
+7.48
598.52%
1 ene 1975 año
6.351
-2.379
-27.25%
1 ene 1976 año
0.526
-5.825
-91.72%
1 ene 1977 año
1.385
+0.859
163.32%
1 ene 1978 año
1.806
+0.421
30.42%
1 ene 1979 año
10.213
+8.407
465.42%
1 ene 1980 año
8.009
-2.205
-21.59%
1 ene 1981 año
10.258
+2.249
28.09%
1 ene 1982 año
10.633
+0.375
3.65%
1 ene 1983 año
13.753
+3.12
29.35%
1 ene 1984 año
7.034
-6.72
-48.86%
1 ene 1985 año
7.885
+0.852
12.11%
1 ene 1986 año
8.09
+0.204
2.59%
1 ene 1987 año
7.55
-0.54
-6.67%
1 ene 1988 año
7.527
-0.023
-0.3%
1 ene 1989 año
9.983
+2.456
32.63%
1 ene 1990 año
3.96
-6.023
-60.33%
1 ene 1991 año
5.724
+1.764
44.54%
1 ene 1992 año
3.746
-1.978
-34.56%
1 ene 1993 año
7.22
+3.474
92.74%
1 ene 1994 año
4.44
-2.779
-38.5%
1 ene 1995 año
4.547
+0.107
2.4%
1 ene 1996 año
2.536
-2.011
-44.23%
1 ene 1997 año
3.733
+1.197
47.21%
1 ene 1998 año
-0.074
-3.807
-101.98%
1 ene 1999 año
6.929
+7.003
-9.47 mil%
1 ene 2000 año
4.069
-2.86
-41.28%
1 ene 2001 año
1.534
-2.534
-62.29%
1 ene 2002 año
9.288
+7.753
505.38%
1 ene 2003 año
4.46
-4.827
-51.98%
1 ene 2004 año
6.904
+2.443
54.78%
1 ene 2005 año
14.011
+7.107
102.95%
1 ene 2006 año
15.507
+1.496
10.68%
1 ene 2007 año
8.653
-6.854
-44.2%
1 ene 2008 año
9.033
+0.379
4.38%
1 ene 2009 año
6.102
-2.931
-32.44%
1 ene 2010 año
-4.176
-10.278
-168.44%
1 ene 2011 año
1.372
+5.548
-132.85%
1 ene 2012 año
2.5
+1.128
82.25%
1 ene 2013 año
2.085
-0.415
-16.62%
1 ene 2014 año
4.845
+2.761
132.44%
1 ene 2015 año
5.649
+0.804
16.59%
1 ene 2016 año
3.901
-1.748
-30.95%
Ranking de los países por los datos estadísticos actuales


Comentarios: