29
/es/
es
AIzaSyAYiBZKx7MnpbEhh9jyipgxe19OcubqV5w
April 1, 2024
156259
Indonesia
IDN
true
2
1
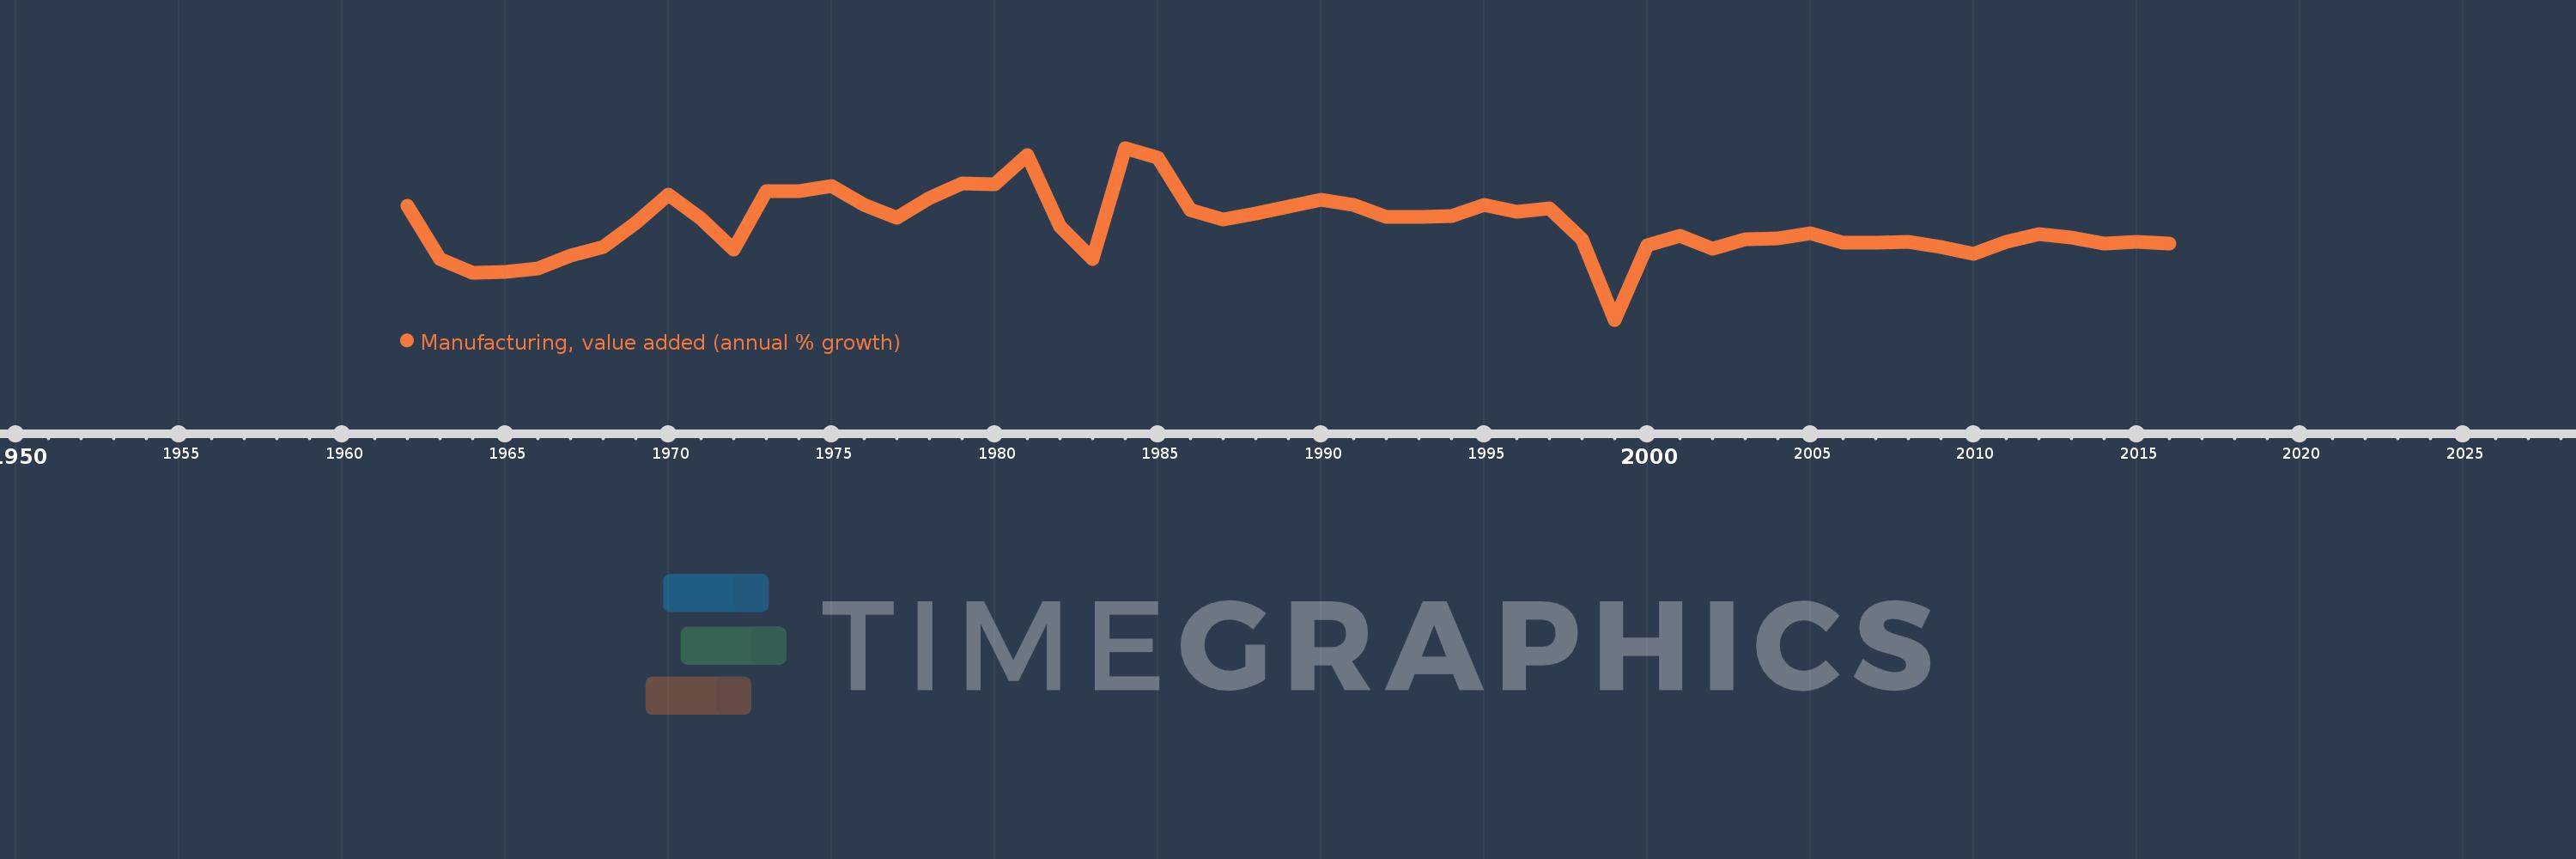
Manufacturing, value added (annual % growth)
2016,2015,2014,2013,2012,2011,2010,2009,2008,2007,2006,2005,2004,2003,2002,2001,2000,1999,1998,1997,1996,1995,1994,1993,1992,1991,1990,1989,1988,1987,1986,1985,1984,1983,1982,1981,1980,1979,1978,1977,1976,1975,1974,1973,1972,1971,1970,1969,1968,1967,1966,1965,1964,1963,1962
Estas estadísticas en otros países:
AfghanistanAlbaniaAlgeriaAntigua and BarbudaArab WorldArgentinaArmeniaAustraliaAustriaAzerbaijanBahamas, TheBahrainBangladeshBelarusBelgiumBelizeBeninBermudaBhutanBoliviaBosnia and HerzegovinaBotswanaBrazilBrunei DarussalamBurkina FasoBurundiCabo VerdeCambodiaCameroonCanadaCaribbean small statesCayman IslandsCentral African RepublicCentral Europe and the BalticsChadChileColombiaComorosCongo, Dem. Rep.Congo, Rep.Costa RicaCote d'IvoireCroatiaCubaCyprusCzech RepublicDenmarkDjiboutiDominicaDominican RepublicEarly-demographic dividendEcuadorEgypt, Arab Rep.El SalvadorEquatorial GuineaEritreaEstoniaEthiopiaEuro areaEurope & Central AsiaEurope & Central Asia (excluding high income)Europe & Central Asia (IDA & IBRD countries)European UnionFijiFinlandFragile and conflict affected situationsFranceGabonGambia, TheGeorgiaGermanyGhanaGreeceGrenadaGuatemalaGuineaGuyanaHaitiHeavily indebted poor countries (HIPC)High incomeHondurasHong Kong SAR, ChinaHungaryIcelandIDA blendIDA onlyIDA totalIndiaIndonesiaIran, Islamic Rep.IraqIrelandItalyJamaicaJapanJordanKazakhstanKenyaKiribatiKorea, Rep.KosovoKuwaitKyrgyz RepublicLao PDRLatin America & Caribbean Latin America & Caribbean (excluding high income)Latin America & the Caribbean (IDA & IBRD countries)LatviaLeast developed countries: UN classificationLebanonLesothoLiberiaLithuaniaLow incomeLower middle incomeLuxembourgMacedonia, FYRMadagascarMalawiMalaysiaMaldivesMarshall IslandsMauritaniaMauritiusMexicoMicronesia, Fed. Sts.Middle East & North AfricaMiddle East & North Africa (excluding high income)Middle East & North Africa (IDA & IBRD countries)MoldovaMongoliaMontenegroMoroccoMozambiqueMyanmarNamibiaNepalNetherlandsNew ZealandNicaraguaNigerNigeriaNorth AmericaNorwayOECD membersOmanOther small statesPacific island small statesPakistanPalauPanamaPapua New GuineaParaguayPeruPhilippinesPolandPortugalPost-demographic dividendPre-demographic dividendPuerto RicoQatarRomaniaRussian FederationRwandaSamoaSao Tome and PrincipeSaudi ArabiaSenegalSerbiaSeychellesSierra LeoneSingaporeSlovak RepublicSloveniaSmall statesSolomon IslandsSomaliaSouth AfricaSouth AsiaSouth Asia (IDA & IBRD)SpainSri LankaSt. Kitts and NevisSt. LuciaSt. Vincent and the GrenadinesSub-Saharan Africa Sub-Saharan Africa (excluding high income)Sub-Saharan Africa (IDA & IBRD countries)SudanSurinameSwazilandSwedenSwitzerlandSyrian Arab RepublicTajikistanTanzaniaThailandTimor-LesteTogoTongaTrinidad and TobagoTunisiaTurkeyTuvaluUgandaUkraineUnited Arab EmiratesUnited KingdomUnited StatesUruguayUzbekistanVanuatuVenezuela, RBVietnamWest Bank and GazaWorldZambiaZimbabwe línea de tiempo (timeline):
En esta escala de tiempo se presenta un gráfico de 1962 y 2016 de Indonesia. Los datos de 1961 están ausentes. El número de observaciones reales por fecha: 55.
Fuente (nombre):
Indicadores del desarrollo mundial
Fuente (organización):
World Bank national accounts data, and OECD National Accounts data files.
Categorías:
Economy & Growth
Se ha actualizado:
23 abr 2017 año
Los indicadores de los cambios de valor en los últimos años
Mínimo:
-11.437
1 ene 1999 año
Máximo:
24.118
1 ene 1984 año
A la fecha de observación
Valor
Cambio absoluto
El cambio con respecto al valor anterior
1 ene 1962 año
12.172
+12.172
0.0%
1 ene 1963 año
1.173
-10.998
-90.36%
1 ene 1964 año
-1.74
-2.913
-248.29%
1 ene 1965 año
-1.475
+0.265
-15.22%
1 ene 1966 año
-0.898
+0.576
-39.09%
1 ene 1967 año
1.813
+2.711
-301.81%
1 ene 1968 año
3.561
+1.748
96.42%
1 ene 1969 año
8.595
+5.034
141.37%
1 ene 1970 año
14.512
+5.917
68.84%
1 ene 1971 año
9.447
-5.065
-34.9%
1 ene 1972 año
3.158
-6.289
-66.57%
1 ene 1973 año
15.101
+11.943
378.18%
1 ene 1974 año
15.249
+0.147
0.97%
1 ene 1975 año
16.154
+0.905
5.94%
1 ene 1976 año
12.318
-3.836
-23.75%
1 ene 1977 año
9.67
-2.648
-21.5%
1 ene 1978 año
13.764
+4.094
42.34%
1 ene 1979 año
16.824
+3.06
22.23%
1 ene 1980 año
16.535
-0.289
-1.72%
1 ene 1981 año
22.721
+6.187
37.42%
1 ene 1982 año
7.858
-14.863
-65.41%
1 ene 1983 año
1.202
-6.657
-84.71%
1 ene 1984 año
24.118
+22.916
1.91 mil%
1 ene 1985 año
22.057
-2.061
-8.54%
1 ene 1986 año
11.191
-10.866
-49.26%
1 ene 1987 año
9.29
-1.901
-16.99%
1 ene 1988 año
10.608
+1.319
14.19%
1 ene 1989 año
11.993
+1.385
13.06%
1 ene 1990 año
13.404
+1.41
11.76%
1 ene 1991 año
12.301
-1.103
-8.23%
1 ene 1992 año
9.9
-2.401
-19.52%
1 ene 1993 año
9.846
-0.054
-0.54%
1 ene 1994 año
9.945
+0.099
1.0%
1 ene 1995 año
12.362
+2.417
24.3%
1 ene 1996 año
10.875
-1.487
-12.03%
1 ene 1997 año
11.592
+0.717
6.59%
1 ene 1998 año
5.251
-6.341
-54.7%
1 ene 1999 año
-11.437
-16.688
-317.78%
1 ene 2000 año
3.921
+15.358
-134.29%
1 ene 2001 año
5.985
+2.064
52.62%
1 ene 2002 año
3.3
-2.685
-44.86%
1 ene 2003 año
5.288
+1.988
60.23%
1 ene 2004 año
5.333
+0.045
0.85%
1 ene 2005 año
6.383
+1.05
19.68%
1 ene 2006 año
4.598
-1.785
-27.96%
1 ene 2007 año
4.585
-0.013
-0.28%
1 ene 2008 año
4.665
+0.08
1.75%
1 ene 2009 año
3.657
-1.008
-21.6%
1 ene 2010 año
2.212
-1.445
-39.52%
1 ene 2011 año
4.742
+2.53
114.36%
1 ene 2012 año
6.259
+1.518
32.01%
1 ene 2013 año
5.62
-0.64
-10.22%
1 ene 2014 año
4.369
-1.251
-22.26%
1 ene 2015 año
4.612
+0.243
5.57%
1 ene 2016 año
4.249
-0.363
-7.87%
Ranking de los países por los datos estadísticos actuales


Comentarios: