30
/es/
AIzaSyAYiBZKx7MnpbEhh9jyipgxe19OcubqV5w
April 1, 2024
277740
Uruguay
URY
true
2
1
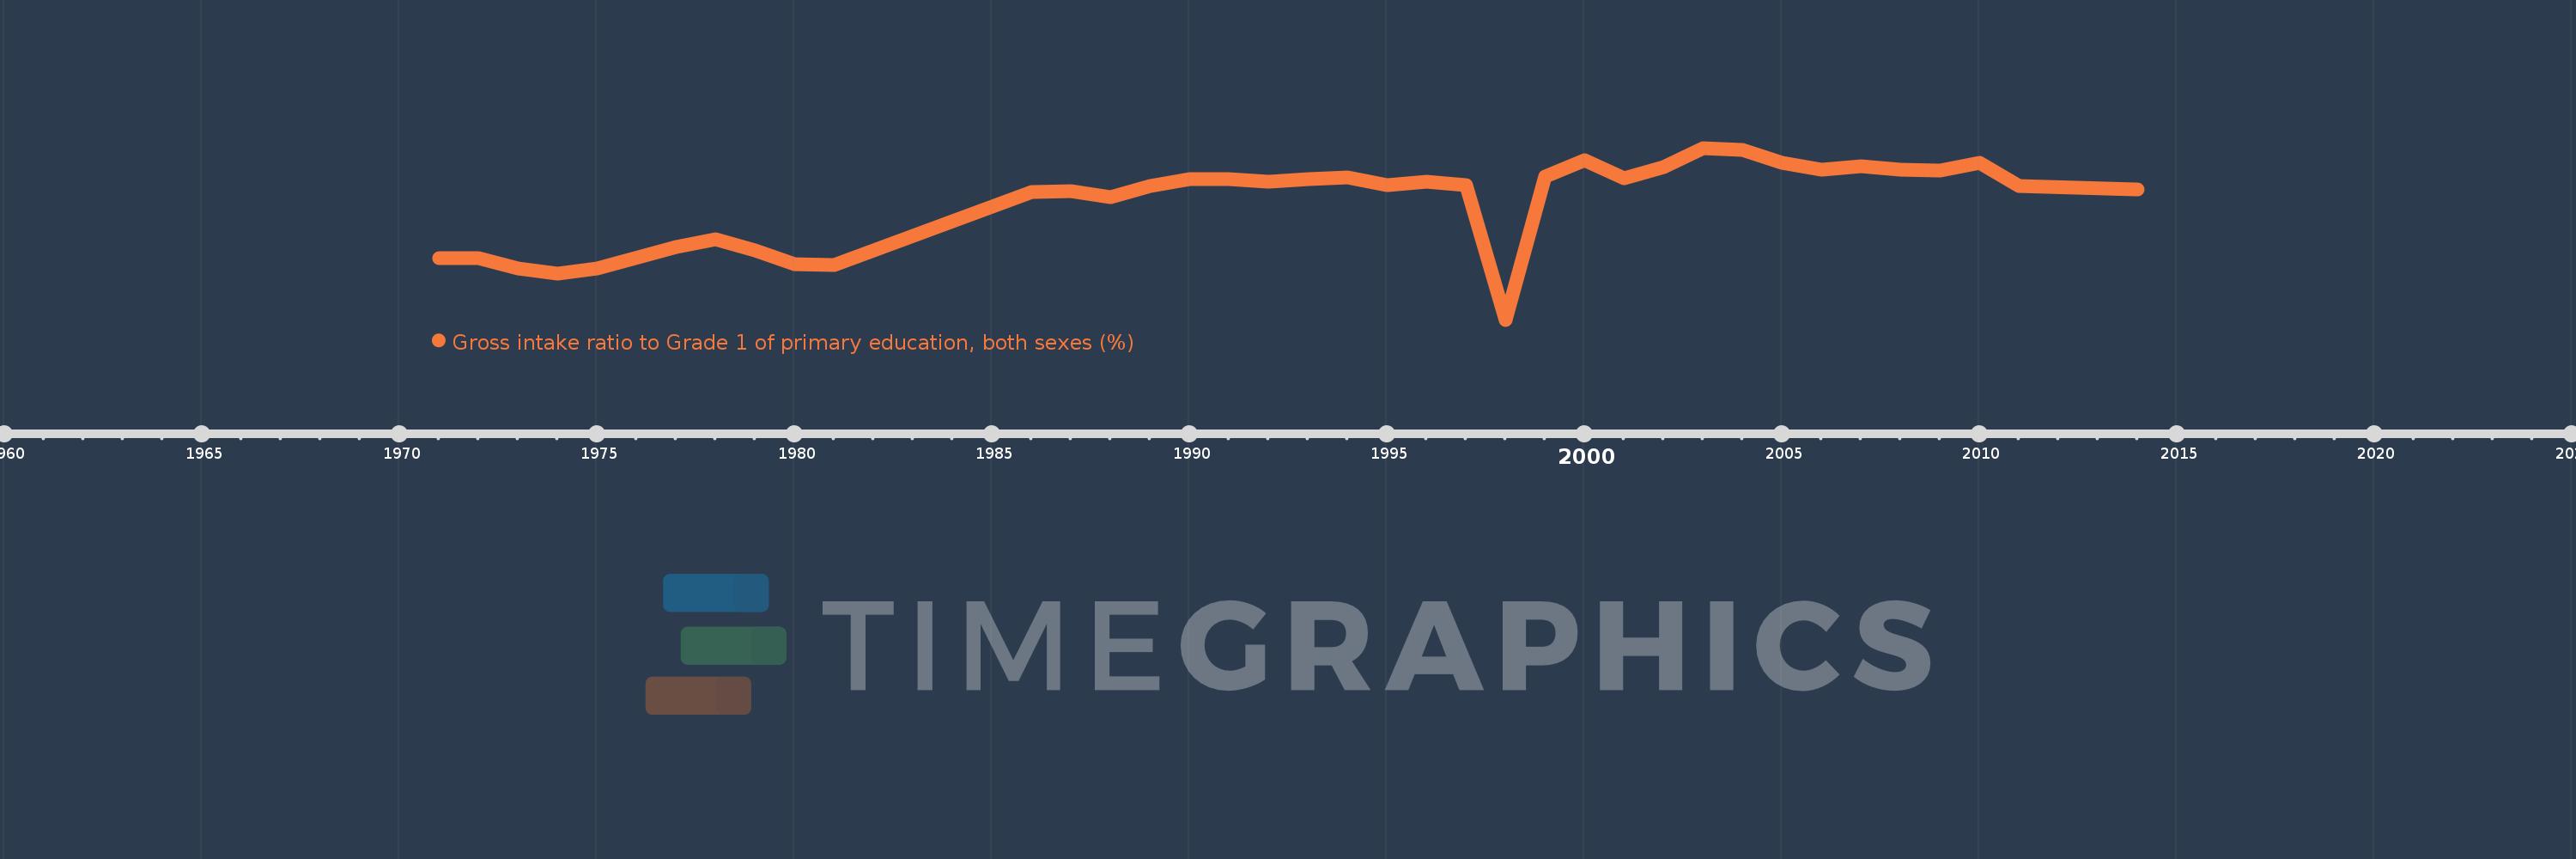
Gross intake ratio to Grade 1 of primary education, both sexes (%)
2014,2011,2010,2009,2008,2007,2006,2005,2004,2003,2002,2001,2000,1999,1998,1997,1996,1995,1994,1993,1992,1991,1990,1989,1988,1987,1986,1981,1980,1979,1978,1977,1975,1974,1973,1972,1971
