29
/es/
es
AIzaSyAYiBZKx7MnpbEhh9jyipgxe19OcubqV5w
April 1, 2024
123558
Ecuador
ECU
true
2
1
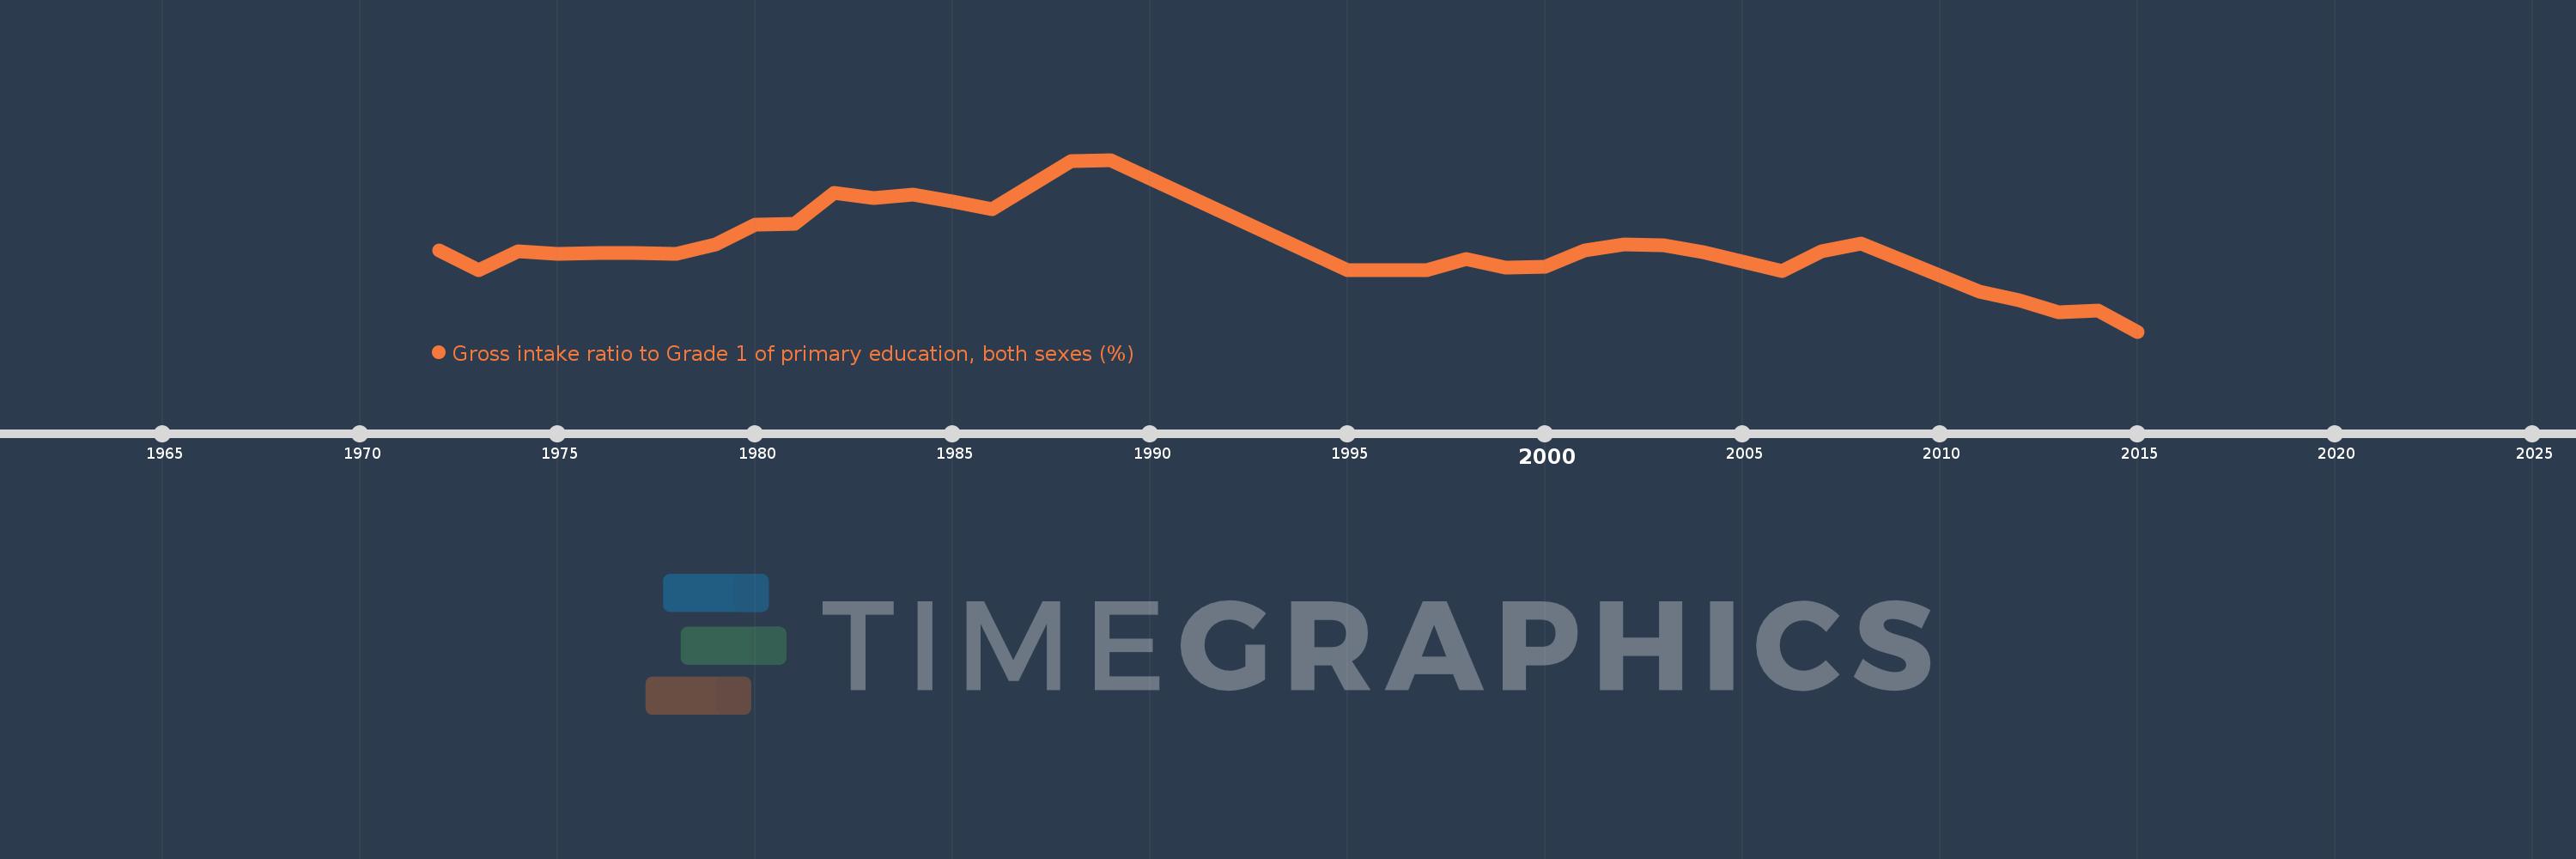
Gross intake ratio to Grade 1 of primary education, both sexes (%)
2015,2014,2013,2012,2011,2008,2007,2006,2005,2004,2003,2002,2001,2000,1999,1998,1997,1996,1995,1989,1988,1986,1985,1984,1983,1982,1981,1980,1979,1978,1977,1976,1975,1974,1973,1972
Estas estadísticas en otros países:
AfghanistanAlbaniaAlgeriaAngolaAntigua and BarbudaArab WorldArgentinaArmeniaArubaAustriaAzerbaijanBahamas, TheBahrainBangladeshBarbadosBelarusBelgiumBelizeBeninBermudaBhutanBoliviaBosnia and HerzegovinaBotswanaBrazilBritish Virgin IslandsBrunei DarussalamBulgariaBurkina FasoBurundiCabo VerdeCambodiaCameroonCanadaCaribbean small statesCentral African RepublicCentral Europe and the BalticsChadChileChinaColombiaComorosCongo, Dem. Rep.Congo, Rep.Costa RicaCote d'IvoireCroatiaCubaCyprusCzech RepublicDenmarkDjiboutiDominicaDominican RepublicEarly-demographic dividendEast Asia & PacificEast Asia & Pacific (excluding high income)East Asia & Pacific (IDA & IBRD countries)EcuadorEgypt, Arab Rep.El SalvadorEquatorial GuineaEritreaEstoniaEthiopiaEuro areaEurope & Central AsiaEurope & Central Asia (excluding high income)Europe & Central Asia (IDA & IBRD countries)European UnionFijiFinlandFragile and conflict affected situationsFranceGabonGambia, TheGeorgiaGermanyGhanaGreeceGrenadaGuatemalaGuineaGuinea-BissauGuyanaHaitiHeavily indebted poor countries (HIPC)High incomeHondurasHong Kong SAR, ChinaHungaryIBRD onlyIcelandIDA & IBRD totalIDA blendIDA onlyIDA totalIndiaIndonesiaIran, Islamic Rep.IraqIrelandIsraelItalyJamaicaJapanJordanKazakhstanKenyaKiribatiKorea, Dem. People’s Rep.Korea, Rep.KuwaitKyrgyz RepublicLao PDRLate-demographic dividendLatin America & Caribbean Latin America & Caribbean (excluding high income)Latin America & the Caribbean (IDA & IBRD countries)LatviaLeast developed countries: UN classificationLebanonLesothoLiberiaLibyaLiechtensteinLithuaniaLow & middle incomeLow incomeLower middle incomeLuxembourgMacao SAR, ChinaMacedonia, FYRMadagascarMalawiMalaysiaMaldivesMaliMaltaMarshall IslandsMauritaniaMauritiusMexicoMicronesia, Fed. Sts.Middle East & North AfricaMiddle East & North Africa (excluding high income)Middle East & North Africa (IDA & IBRD countries)Middle incomeMoldovaMongoliaMontenegroMoroccoMozambiqueMyanmarNamibiaNauruNepalNetherlandsNew ZealandNicaraguaNigerNigeriaNorth AmericaNorwayOECD membersOmanOther small statesPacific island small statesPakistanPalauPanamaPapua New GuineaParaguayPeruPhilippinesPolandPortugalPost-demographic dividendPre-demographic dividendPuerto RicoQatarRomaniaRussian FederationRwandaSamoaSan MarinoSao Tome and PrincipeSaudi ArabiaSenegalSerbiaSeychellesSierra LeoneSlovak RepublicSloveniaSmall statesSolomon IslandsSouth AfricaSouth AsiaSouth Asia (IDA & IBRD)South SudanSpainSri LankaSt. Kitts and NevisSt. LuciaSt. Vincent and the GrenadinesSub-Saharan Africa Sub-Saharan Africa (excluding high income)Sub-Saharan Africa (IDA & IBRD countries)SudanSurinameSwazilandSwedenSwitzerlandSyrian Arab RepublicTajikistanTanzaniaThailandTimor-LesteTogoTongaTrinidad and TobagoTunisiaTurkeyTuvaluUgandaUkraineUnited Arab EmiratesUnited StatesUpper middle incomeUruguayUzbekistanVanuatuVenezuela, RBVietnamWest Bank and GazaWorldYemen, Rep.ZambiaZimbabwe línea de tiempo (timeline):
En esta escala de tiempo se presenta un gráfico de 1972 y 2015 de Ecuador. Los datos de 1971 están ausentes. El número de observaciones reales por fecha: 36.
Fuente (nombre):
Indicadores del desarrollo mundial
Fuente (organización):
UNESCO Institute for Statistics
Categorías:
Education
Se ha actualizado:
23 abr 2017 año
Los indicadores de los cambios de valor en los últimos años
Mínimo:
111.35
1 ene 2015 año
Máximo:
154.583
1 ene 1989 año
A la fecha de observación
Valor
Cambio absoluto
El cambio con respecto al valor anterior
1 ene 1972 año
131.821
+131.821
0.0%
1 ene 1973 año
126.902
-4.919
-3.73%
1 ene 1974 año
131.507
+4.606
3.63%
1 ene 1975 año
130.829
-0.678
-0.52%
1 ene 1976 año
131.043
+0.214
0.16%
1 ene 1977 año
131.023
-0.021
-0.02%
1 ene 1978 año
131.014
-0.009
-0.01%
1 ene 1979 año
133.354
+2.34
1.79%
1 ene 1980 año
138.24
+4.887
3.66%
1 ene 1981 año
138.398
+0.157
0.11%
1 ene 1982 año
146.292
+7.894
5.7%
1 ene 1983 año
144.952
-1.34
-0.92%
1 ene 1984 año
145.75
+0.798
0.55%
1 ene 1985 año
144.192
-1.558
-1.07%
1 ene 1986 año
142.248
-1.943
-1.35%
1 ene 1988 año
154.306
+12.057
8.48%
1 ene 1989 año
154.583
+0.277
0.18%
1 ene 1995 año
126.726
-27.857
-18.02%
1 ene 1996 año
126.798
+0.073
0.06%
1 ene 1997 año
126.884
+0.085
0.07%
1 ene 1998 año
129.533
+2.649
2.09%
1 ene 1999 año
127.454
-2.079
-1.6%
1 ene 2000 año
127.742
+0.288
0.23%
1 ene 2001 año
131.793
+4.051
3.17%
1 ene 2002 año
133.186
+1.393
1.06%
1 ene 2003 año
133.067
-0.119
-0.09%
1 ene 2004 año
131.388
-1.679
-1.26%
1 ene 2005 año
128.909
-2.479
-1.89%
1 ene 2006 año
126.672
-2.236
-1.73%
1 ene 2007 año
131.514
+4.842
3.82%
1 ene 2008 año
133.6
+2.086
1.59%
1 ene 2011 año
121.322
-12.278
-9.19%
1 ene 2012 año
119.261
-2.061
-1.7%
1 ene 2013 año
116.124
-3.137
-2.63%
1 ene 2014 año
116.586
+0.463
0.4%
1 ene 2015 año
111.35
-5.236
-4.49%
Ranking de los países por los datos estadísticos actuales


Comentarios: