29
/es/
es
AIzaSyAYiBZKx7MnpbEhh9jyipgxe19OcubqV5w
April 1, 2024
210435
Nicaragua
NIC
true
2
1
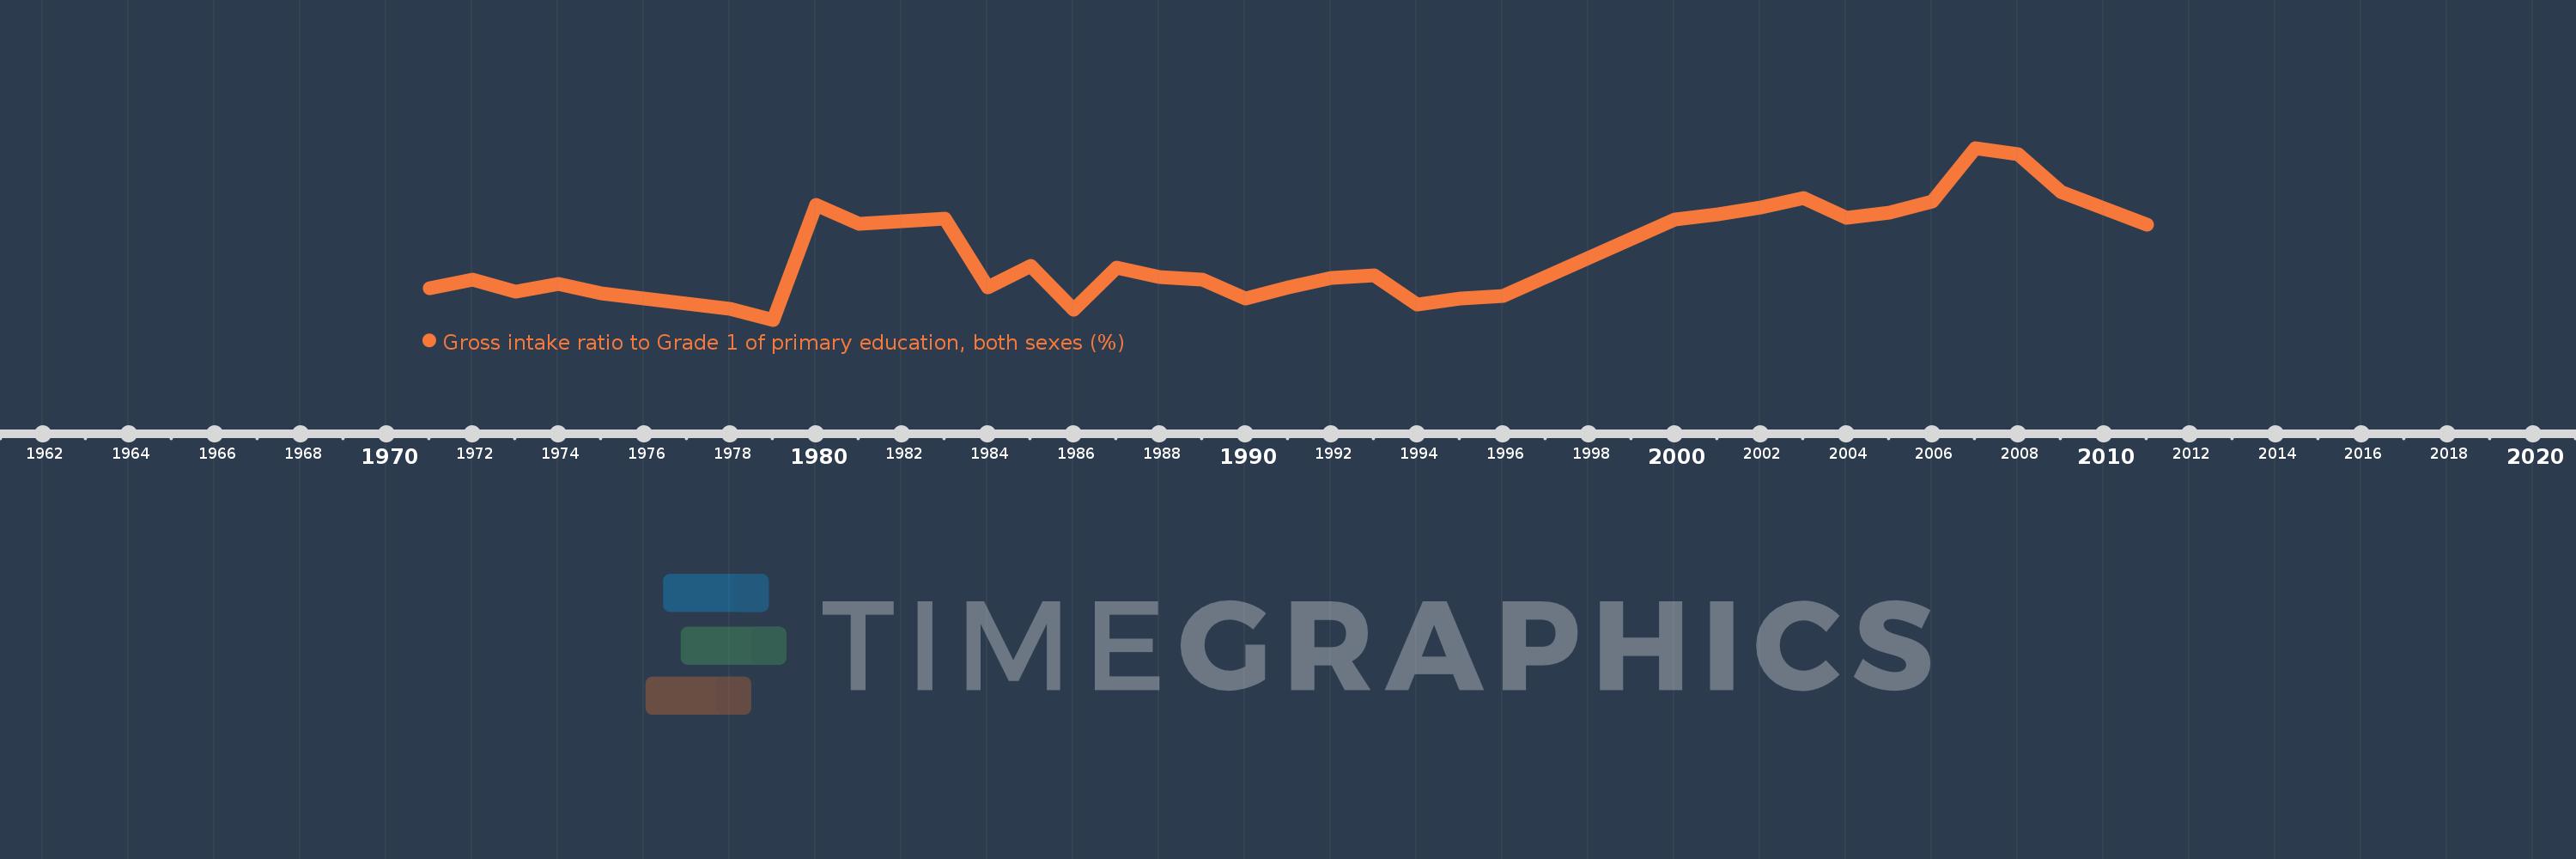
Gross intake ratio to Grade 1 of primary education, both sexes (%)
2011,2009,2008,2007,2006,2005,2004,2003,2002,2001,2000,1996,1995,1994,1993,1992,1991,1990,1989,1988,1987,1986,1985,1984,1983,1981,1980,1979,1978,1975,1974,1973,1972,1971
Estas estadísticas en otros países:
AfghanistanAlbaniaAlgeriaAngolaAntigua and BarbudaArab WorldArgentinaArmeniaArubaAustriaAzerbaijanBahamas, TheBahrainBangladeshBarbadosBelarusBelgiumBelizeBeninBermudaBhutanBoliviaBosnia and HerzegovinaBotswanaBrazilBritish Virgin IslandsBrunei DarussalamBulgariaBurkina FasoBurundiCabo VerdeCambodiaCameroonCanadaCaribbean small statesCentral African RepublicCentral Europe and the BalticsChadChileChinaColombiaComorosCongo, Dem. Rep.Congo, Rep.Costa RicaCote d'IvoireCroatiaCubaCyprusCzech RepublicDenmarkDjiboutiDominicaDominican RepublicEarly-demographic dividendEast Asia & PacificEast Asia & Pacific (excluding high income)East Asia & Pacific (IDA & IBRD countries)EcuadorEgypt, Arab Rep.El SalvadorEquatorial GuineaEritreaEstoniaEthiopiaEuro areaEurope & Central AsiaEurope & Central Asia (excluding high income)Europe & Central Asia (IDA & IBRD countries)European UnionFijiFinlandFragile and conflict affected situationsFranceGabonGambia, TheGeorgiaGermanyGhanaGreeceGrenadaGuatemalaGuineaGuinea-BissauGuyanaHaitiHeavily indebted poor countries (HIPC)High incomeHondurasHong Kong SAR, ChinaHungaryIBRD onlyIcelandIDA & IBRD totalIDA blendIDA onlyIDA totalIndiaIndonesiaIran, Islamic Rep.IraqIrelandIsraelItalyJamaicaJapanJordanKazakhstanKenyaKiribatiKorea, Dem. People’s Rep.Korea, Rep.KuwaitKyrgyz RepublicLao PDRLate-demographic dividendLatin America & Caribbean Latin America & Caribbean (excluding high income)Latin America & the Caribbean (IDA & IBRD countries)LatviaLeast developed countries: UN classificationLebanonLesothoLiberiaLibyaLiechtensteinLithuaniaLow & middle incomeLow incomeLower middle incomeLuxembourgMacao SAR, ChinaMacedonia, FYRMadagascarMalawiMalaysiaMaldivesMaliMaltaMarshall IslandsMauritaniaMauritiusMexicoMicronesia, Fed. Sts.Middle East & North AfricaMiddle East & North Africa (excluding high income)Middle East & North Africa (IDA & IBRD countries)Middle incomeMoldovaMongoliaMontenegroMoroccoMozambiqueMyanmarNamibiaNauruNepalNetherlandsNew ZealandNicaraguaNigerNigeriaNorth AmericaNorwayOECD membersOmanOther small statesPacific island small statesPakistanPalauPanamaPapua New GuineaParaguayPeruPhilippinesPolandPortugalPost-demographic dividendPre-demographic dividendPuerto RicoQatarRomaniaRussian FederationRwandaSamoaSan MarinoSao Tome and PrincipeSaudi ArabiaSenegalSerbiaSeychellesSierra LeoneSlovak RepublicSloveniaSmall statesSolomon IslandsSouth AfricaSouth AsiaSouth Asia (IDA & IBRD)South SudanSpainSri LankaSt. Kitts and NevisSt. LuciaSt. Vincent and the GrenadinesSub-Saharan Africa Sub-Saharan Africa (excluding high income)Sub-Saharan Africa (IDA & IBRD countries)SudanSurinameSwazilandSwedenSwitzerlandSyrian Arab RepublicTajikistanTanzaniaThailandTimor-LesteTogoTongaTrinidad and TobagoTunisiaTurkeyTuvaluUgandaUkraineUnited Arab EmiratesUnited StatesUpper middle incomeUruguayUzbekistanVanuatuVenezuela, RBVietnamWest Bank and GazaWorldYemen, Rep.ZambiaZimbabwe línea de tiempo (timeline):
En esta escala de tiempo se presenta un gráfico de 1971 y 2011 de Nicaragua. Los datos de 1970 están ausentes. El número de observaciones reales por fecha: 34.
Fuente (nombre):
Indicadores del desarrollo mundial
Fuente (organización):
UNESCO Institute for Statistics
Categorías:
Education
Se ha actualizado:
23 abr 2017 año
Los indicadores de los cambios de valor en los últimos años
Mínimo:
112.597
1 ene 1979 año
Máximo:
177.322
1 ene 2007 año
A la fecha de observación
Valor
Cambio absoluto
El cambio con respecto al valor anterior
1 ene 1971 año
124.315
+124.315
0.0%
1 ene 1972 año
127.725
+3.41
2.74%
1 ene 1973 año
123.115
-4.61
-3.61%
1 ene 1974 año
125.949
+2.834
2.3%
1 ene 1975 año
122.691
-3.258
-2.59%
1 ene 1978 año
116.762
-5.928
-4.83%
1 ene 1979 año
112.597
-4.165
-3.57%
1 ene 1980 año
155.935
+43.338
38.49%
1 ene 1981 año
148.818
-7.117
-4.56%
1 ene 1983 año
150.774
+1.956
1.31%
1 ene 1984 año
124.876
-25.898
-17.18%
1 ene 1985 año
133.028
+8.151
6.53%
1 ene 1986 año
116.371
-16.657
-12.52%
1 ene 1987 año
132.202
+15.832
13.6%
1 ene 1988 año
128.777
-3.425
-2.59%
1 ene 1989 año
127.712
-1.065
-0.83%
1 ene 1990 año
120.606
-7.107
-5.56%
1 ene 1991 año
124.95
+4.344
3.6%
1 ene 1992 año
128.362
+3.412
2.73%
1 ene 1993 año
129.343
+0.981
0.76%
1 ene 1994 año
118.209
-11.135
-8.61%
1 ene 1995 año
120.519
+2.311
1.95%
1 ene 1996 año
121.501
+0.982
0.81%
1 ene 2000 año
150.494
+28.993
23.86%
1 ene 2001 año
152.15
+1.656
1.1%
1 ene 2002 año
154.959
+2.81
1.85%
1 ene 2003 año
158.551
+3.592
2.32%
1 ene 2004 año
151.13
-7.421
-4.68%
1 ene 2005 año
152.864
+1.734
1.15%
1 ene 2006 año
157.127
+4.263
2.79%
1 ene 2007 año
177.322
+20.195
12.85%
1 ene 2008 año
175.116
-2.206
-1.24%
1 ene 2009 año
160.572
-14.544
-8.31%
1 ene 2011 año
148.437
-12.135
-7.56%
Ranking de los países por los datos estadísticos actuales


Comentarios: