29
/es/
es
AIzaSyAYiBZKx7MnpbEhh9jyipgxe19OcubqV5w
April 1, 2024
27693
East Asia & Pacific
EAS
false
2
1
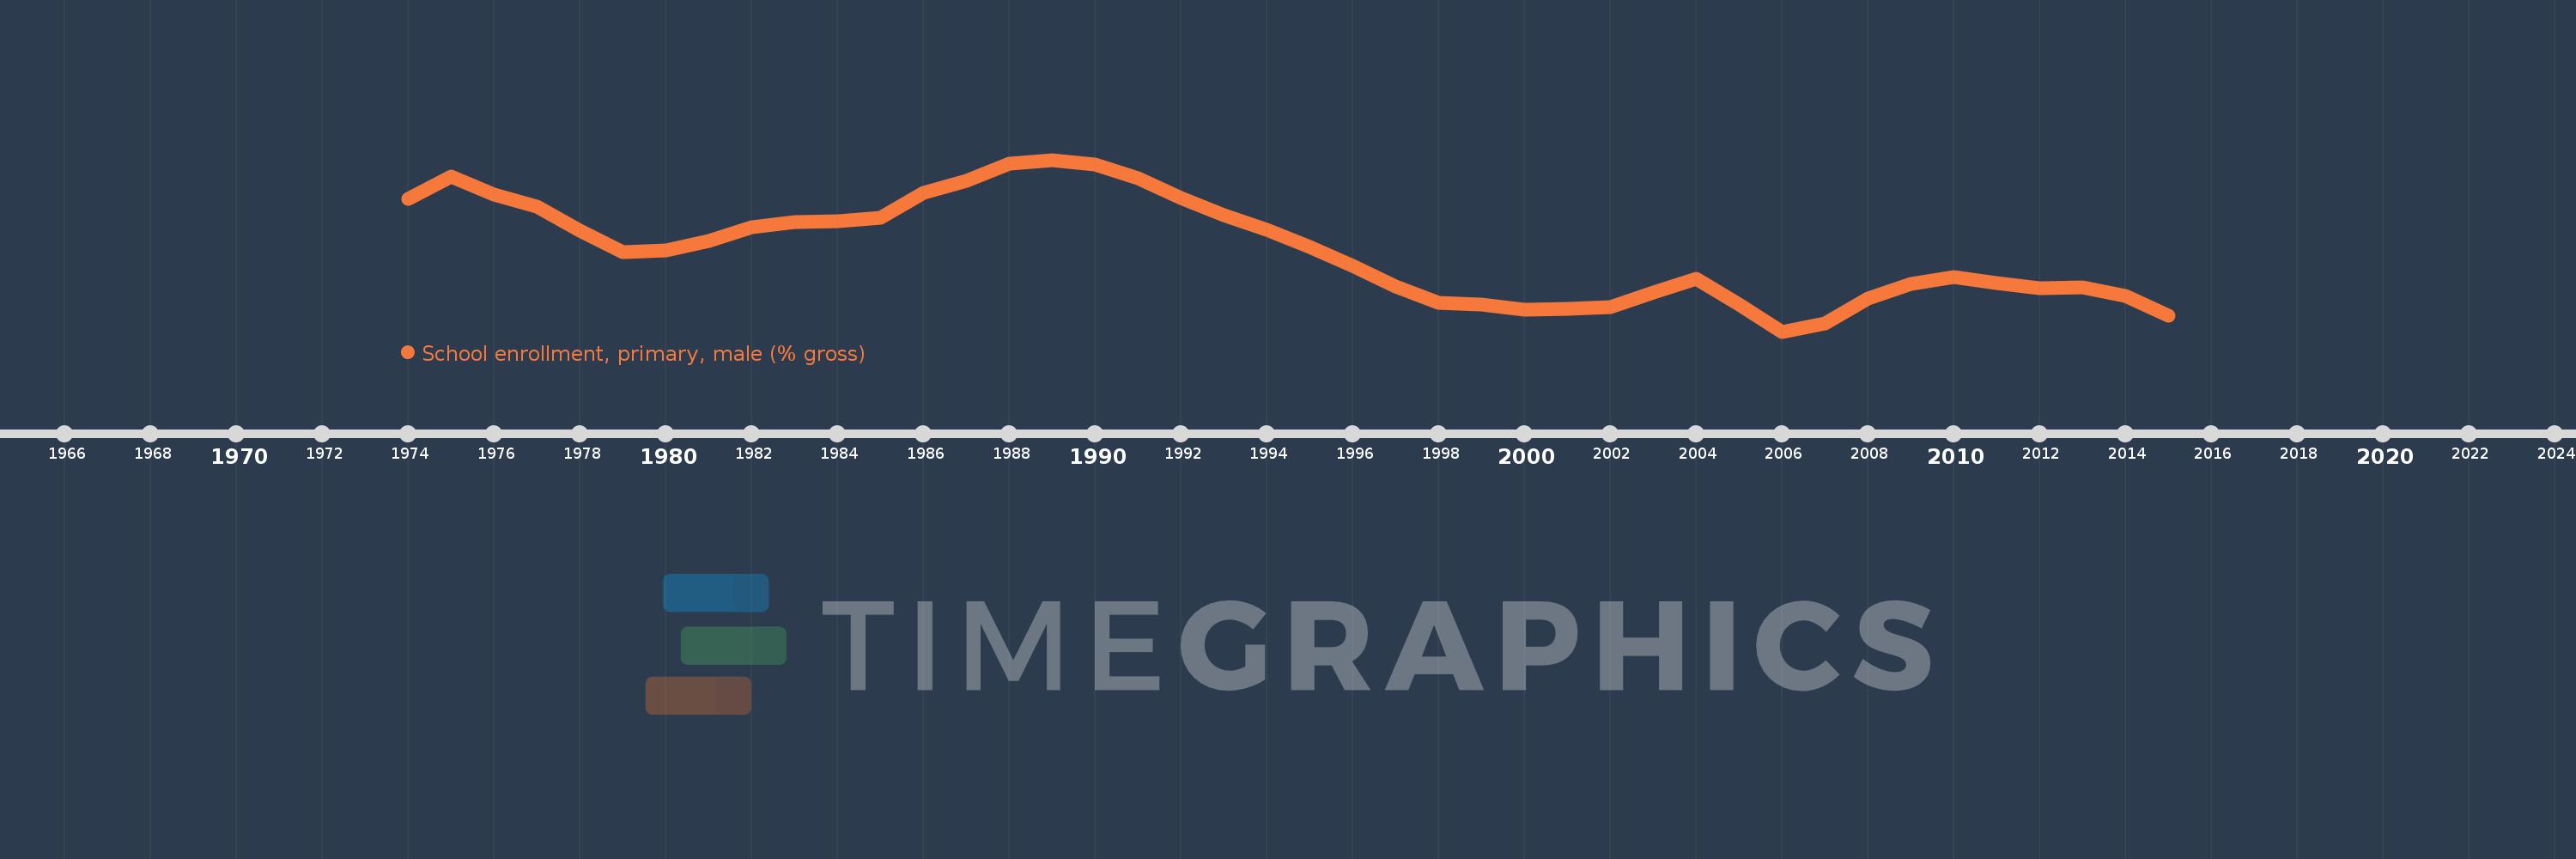
School enrollment, primary, male (% gross)
2015,2014,2013,2012,2011,2010,2009,2008,2007,2006,2005,2004,2003,2002,2001,2000,1999,1998,1997,1996,1995,1994,1993,1992,1991,1990,1989,1988,1987,1986,1985,1984,1983,1982,1981,1980,1979,1978,1977,1976,1975,1974
Estas estadísticas en otros países:
AfghanistanAlbaniaAlgeriaAndorraAngolaAntigua and BarbudaArab WorldArgentinaArmeniaArubaAustraliaAustriaAzerbaijanBahamas, TheBahrainBangladeshBarbadosBelarusBelgiumBelizeBeninBermudaBhutanBoliviaBosnia and HerzegovinaBotswanaBrazilBrunei DarussalamBulgariaBurkina FasoBurundiCabo VerdeCambodiaCameroonCanadaCaribbean small statesCentral African RepublicCentral Europe and the BalticsChadChileChinaColombiaComorosCongo, Dem. Rep.Congo, Rep.Costa RicaCote d'IvoireCroatiaCubaCuracaoCyprusCzech RepublicDenmarkDjiboutiDominicaDominican RepublicEarly-demographic dividendEast Asia & PacificEast Asia & Pacific (excluding high income)East Asia & Pacific (IDA & IBRD countries)EcuadorEgypt, Arab Rep.El SalvadorEquatorial GuineaEritreaEstoniaEthiopiaEuro areaEurope & Central AsiaEurope & Central Asia (excluding high income)Europe & Central Asia (IDA & IBRD countries)European UnionFijiFinlandFragile and conflict affected situationsFranceGabonGambia, TheGeorgiaGermanyGhanaGreeceGrenadaGuatemalaGuineaGuinea-BissauGuyanaHaitiHeavily indebted poor countries (HIPC)High incomeHondurasHong Kong SAR, ChinaHungaryIBRD onlyIcelandIDA & IBRD totalIDA blendIDA onlyIDA totalIndiaIndonesiaIran, Islamic Rep.IraqIrelandIsraelItalyJamaicaJapanJordanKazakhstanKenyaKiribatiKorea, Dem. People’s Rep.Korea, Rep.KuwaitKyrgyz RepublicLao PDRLate-demographic dividendLatin America & Caribbean Latin America & Caribbean (excluding high income)Latin America & the Caribbean (IDA & IBRD countries)LatviaLeast developed countries: UN classificationLebanonLesothoLiberiaLibyaLiechtensteinLithuaniaLow & middle incomeLow incomeLower middle incomeLuxembourgMacao SAR, ChinaMacedonia, FYRMadagascarMalawiMaldivesMaliMaltaMarshall IslandsMauritaniaMauritiusMexicoMicronesia, Fed. Sts.Middle East & North AfricaMiddle East & North Africa (excluding high income)Middle East & North Africa (IDA & IBRD countries)Middle incomeMoldovaMongoliaMontenegroMoroccoMozambiqueMyanmarNamibiaNauruNepalNetherlandsNew ZealandNicaraguaNigerNigeriaNorth AmericaNorwayOECD membersOmanOther small statesPacific island small statesPakistanPalauPanamaPapua New GuineaParaguayPeruPhilippinesPolandPortugalPost-demographic dividendPre-demographic dividendPuerto RicoQatarRomaniaRussian FederationRwandaSamoaSan MarinoSao Tome and PrincipeSaudi ArabiaSenegalSerbiaSeychellesSierra LeoneSlovak RepublicSloveniaSmall statesSolomon IslandsSomaliaSouth AfricaSouth AsiaSouth Asia (IDA & IBRD)South SudanSpainSri LankaSt. Kitts and NevisSt. LuciaSt. Vincent and the GrenadinesSub-Saharan Africa Sub-Saharan Africa (excluding high income)Sub-Saharan Africa (IDA & IBRD countries)SudanSurinameSwazilandSwedenSwitzerlandSyrian Arab RepublicTajikistanTanzaniaThailandTimor-LesteTogoTongaTrinidad and TobagoTunisiaTurkeyTurkmenistanTuvaluUgandaUkraineUnited Arab EmiratesUnited KingdomUnited StatesUpper middle incomeUruguayUzbekistanVanuatuVenezuela, RBVietnamWest Bank and GazaWorldYemen, Rep.ZambiaZimbabwe línea de tiempo (timeline):
En esta escala de tiempo se presenta un gráfico de 1974 y 2015 de East Asia & Pacific. Los datos de 1973 están ausentes. El número de observaciones reales por fecha: 42.
Fuente (nombre):
Indicadores del desarrollo mundial
Fuente (organización):
United Nations Educational, Scientific, and Cultural Organization (UNESCO) Institute for Statistics.
Categorías:
Education, Gender
Se ha actualizado:
23 abr 2017 año
Los indicadores de los cambios de valor en los últimos años
Mínimo:
103.76
1 ene 2006 año
Máximo:
125.557
1 ene 1989 año
A la fecha de observación
Valor
Cambio absoluto
El cambio con respecto al valor anterior
1 ene 1974 año
120.598
+120.598
0.0%
1 ene 1975 año
123.471
+2.872
2.38%
1 ene 1976 año
121.189
-2.281
-1.85%
1 ene 1977 año
119.598
-1.592
-1.31%
1 ene 1978 año
116.531
-3.067
-2.56%
1 ene 1979 año
113.792
-2.739
-2.35%
1 ene 1980 año
114.109
+0.317
0.28%
1 ene 1981 año
115.212
+1.103
0.97%
1 ene 1982 año
116.962
+1.75
1.52%
1 ene 1983 año
117.626
+0.665
0.57%
1 ene 1984 año
117.732
+0.105
0.09%
1 ene 1985 año
118.234
+0.502
0.43%
1 ene 1986 año
121.349
+3.115
2.63%
1 ene 1987 año
122.835
+1.486
1.22%
1 ene 1988 año
125.053
+2.219
1.81%
1 ene 1989 año
125.557
+0.503
0.4%
1 ene 1990 año
124.948
-0.609
-0.49%
1 ene 1991 año
123.203
-1.745
-1.4%
1 ene 1992 año
120.684
-2.518
-2.04%
1 ene 1993 año
118.577
-2.107
-1.75%
1 ene 1994 año
116.685
-1.893
-1.6%
1 ene 1995 año
114.476
-2.209
-1.89%
1 ene 1996 año
112.141
-2.334
-2.04%
1 ene 1997 año
109.519
-2.622
-2.34%
1 ene 1998 año
107.432
-2.086
-1.91%
1 ene 1999 año
107.167
-0.265
-0.25%
1 ene 2000 año
106.581
-0.586
-0.55%
1 ene 2001 año
106.629
+0.048
0.04%
1 ene 2002 año
106.886
+0.257
0.24%
1 ene 2003 año
108.703
+1.817
1.7%
1 ene 2004 año
110.469
+1.766
1.62%
1 ene 2005 año
107.165
-3.304
-2.99%
1 ene 2006 año
103.76
-3.404
-3.18%
1 ene 2007 año
104.781
+1.02
0.98%
1 ene 2008 año
107.989
+3.209
3.06%
1 ene 2009 año
109.787
+1.798
1.67%
1 ene 2010 año
110.658
+0.871
0.79%
1 ene 2011 año
109.959
-0.699
-0.63%
1 ene 2012 año
109.299
-0.66
-0.6%
1 ene 2013 año
109.384
+0.084
0.08%
1 ene 2014 año
108.318
-1.066
-0.97%
1 ene 2015 año
105.83
-2.488
-2.3%
Ranking de los países por los datos estadísticos actuales


Comentarios: