29
/es/
es
AIzaSyAYiBZKx7MnpbEhh9jyipgxe19OcubqV5w
April 1, 2024
196254
Mexico
MEX
true
2
1
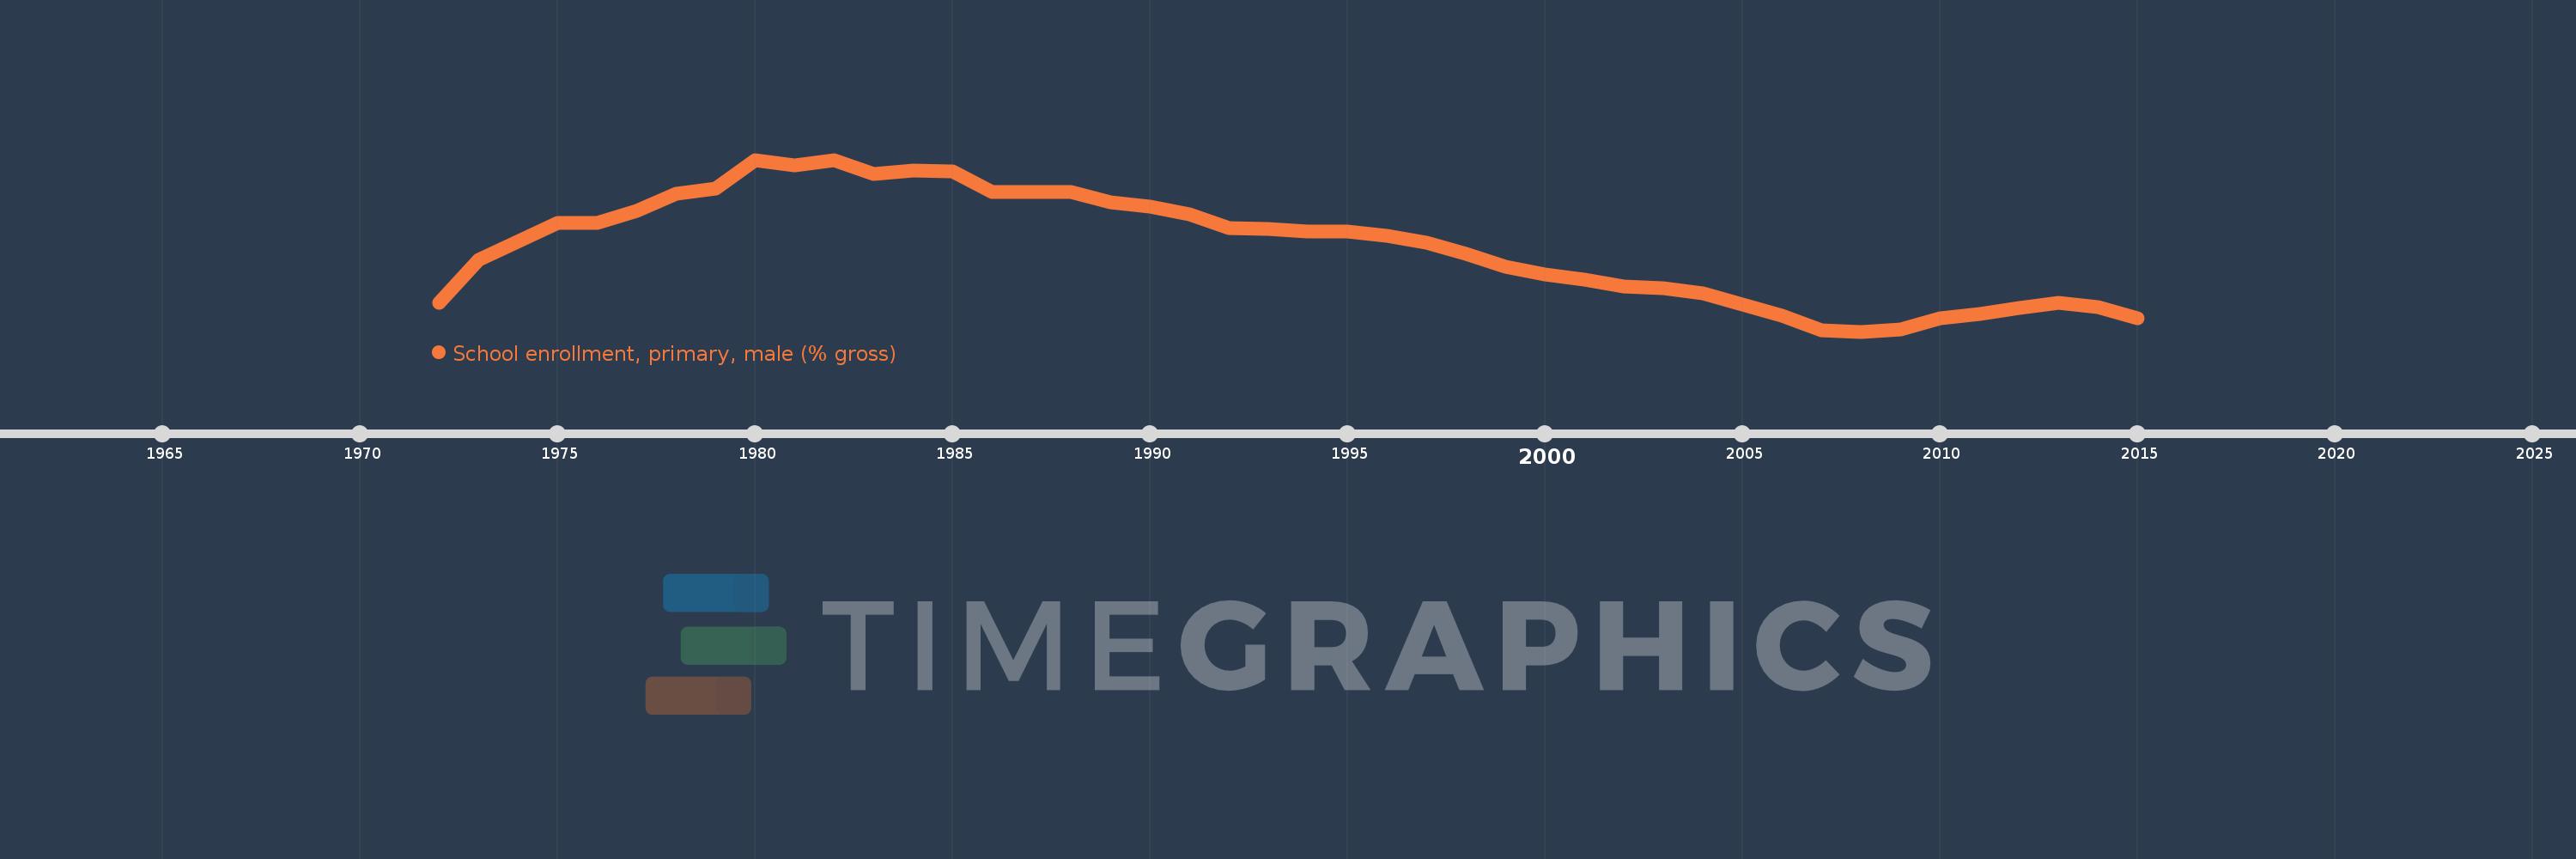
School enrollment, primary, male (% gross)
2015,2014,2013,2012,2011,2010,2009,2008,2007,2006,2005,2004,2003,2002,2001,2000,1999,1998,1997,1996,1995,1994,1993,1992,1991,1990,1989,1988,1987,1986,1985,1984,1983,1982,1981,1980,1979,1978,1977,1976,1975,1973,1972
Estas estadísticas en otros países:
AfghanistanAlbaniaAlgeriaAndorraAngolaAntigua and BarbudaArab WorldArgentinaArmeniaArubaAustraliaAustriaAzerbaijanBahamas, TheBahrainBangladeshBarbadosBelarusBelgiumBelizeBeninBermudaBhutanBoliviaBosnia and HerzegovinaBotswanaBrazilBrunei DarussalamBulgariaBurkina FasoBurundiCabo VerdeCambodiaCameroonCanadaCaribbean small statesCentral African RepublicCentral Europe and the BalticsChadChileChinaColombiaComorosCongo, Dem. Rep.Congo, Rep.Costa RicaCote d'IvoireCroatiaCubaCuracaoCyprusCzech RepublicDenmarkDjiboutiDominicaDominican RepublicEarly-demographic dividendEast Asia & PacificEast Asia & Pacific (excluding high income)East Asia & Pacific (IDA & IBRD countries)EcuadorEgypt, Arab Rep.El SalvadorEquatorial GuineaEritreaEstoniaEthiopiaEuro areaEurope & Central AsiaEurope & Central Asia (excluding high income)Europe & Central Asia (IDA & IBRD countries)European UnionFijiFinlandFragile and conflict affected situationsFranceGabonGambia, TheGeorgiaGermanyGhanaGreeceGrenadaGuatemalaGuineaGuinea-BissauGuyanaHaitiHeavily indebted poor countries (HIPC)High incomeHondurasHong Kong SAR, ChinaHungaryIBRD onlyIcelandIDA & IBRD totalIDA blendIDA onlyIDA totalIndiaIndonesiaIran, Islamic Rep.IraqIrelandIsraelItalyJamaicaJapanJordanKazakhstanKenyaKiribatiKorea, Dem. People’s Rep.Korea, Rep.KuwaitKyrgyz RepublicLao PDRLate-demographic dividendLatin America & Caribbean Latin America & Caribbean (excluding high income)Latin America & the Caribbean (IDA & IBRD countries)LatviaLeast developed countries: UN classificationLebanonLesothoLiberiaLibyaLiechtensteinLithuaniaLow & middle incomeLow incomeLower middle incomeLuxembourgMacao SAR, ChinaMacedonia, FYRMadagascarMalawiMaldivesMaliMaltaMarshall IslandsMauritaniaMauritiusMexicoMicronesia, Fed. Sts.Middle East & North AfricaMiddle East & North Africa (excluding high income)Middle East & North Africa (IDA & IBRD countries)Middle incomeMoldovaMongoliaMontenegroMoroccoMozambiqueMyanmarNamibiaNauruNepalNetherlandsNew ZealandNicaraguaNigerNigeriaNorth AmericaNorwayOECD membersOmanOther small statesPacific island small statesPakistanPalauPanamaPapua New GuineaParaguayPeruPhilippinesPolandPortugalPost-demographic dividendPre-demographic dividendPuerto RicoQatarRomaniaRussian FederationRwandaSamoaSan MarinoSao Tome and PrincipeSaudi ArabiaSenegalSerbiaSeychellesSierra LeoneSlovak RepublicSloveniaSmall statesSolomon IslandsSomaliaSouth AfricaSouth AsiaSouth Asia (IDA & IBRD)South SudanSpainSri LankaSt. Kitts and NevisSt. LuciaSt. Vincent and the GrenadinesSub-Saharan Africa Sub-Saharan Africa (excluding high income)Sub-Saharan Africa (IDA & IBRD countries)SudanSurinameSwazilandSwedenSwitzerlandSyrian Arab RepublicTajikistanTanzaniaThailandTimor-LesteTogoTongaTrinidad and TobagoTunisiaTurkeyTurkmenistanTuvaluUgandaUkraineUnited Arab EmiratesUnited KingdomUnited StatesUpper middle incomeUruguayUzbekistanVanuatuVenezuela, RBVietnamWest Bank and GazaWorldYemen, Rep.ZambiaZimbabwe línea de tiempo (timeline):
En esta escala de tiempo se presenta un gráfico de 1972 y 2015 de Mexico. Los datos de 1971 están ausentes. El número de observaciones reales por fecha: 43.
Fuente (nombre):
Indicadores del desarrollo mundial
Fuente (organización):
United Nations Educational, Scientific, and Cultural Organization (UNESCO) Institute for Statistics.
Categorías:
Education, Gender
Se ha actualizado:
23 abr 2017 año
Los indicadores de los cambios de valor en los últimos años
Mínimo:
102.427
1 ene 2008 año
Máximo:
117.77
1 ene 1980 año
A la fecha de observación
Valor
Cambio absoluto
El cambio con respecto al valor anterior
1 ene 1972 año
105.015
+105.015
0.0%
1 ene 1973 año
108.867
+3.852
3.67%
1 ene 1975 año
112.096
+3.229
2.97%
1 ene 1976 año
112.097
+0.001
0.0%
1 ene 1977 año
113.225
+1.128
1.01%
1 ene 1978 año
114.746
+1.521
1.34%
1 ene 1979 año
115.193
+0.447
0.39%
1 ene 1980 año
117.77
+2.576
2.24%
1 ene 1981 año
117.233
-0.537
-0.46%
1 ene 1982 año
117.716
+0.483
0.41%
1 ene 1983 año
116.475
-1.241
-1.05%
1 ene 1984 año
116.841
+0.366
0.31%
1 ene 1985 año
116.703
-0.138
-0.12%
1 ene 1986 año
114.878
-1.825
-1.56%
1 ene 1987 año
114.867
-0.012
-0.01%
1 ene 1988 año
114.893
+0.027
0.02%
1 ene 1989 año
113.986
-0.907
-0.79%
1 ene 1990 año
113.57
-0.417
-0.37%
1 ene 1991 año
112.889
-0.68
-0.6%
1 ene 1992 año
111.693
-1.197
-1.06%
1 ene 1993 año
111.558
-0.134
-0.12%
1 ene 1994 año
111.394
-0.164
-0.15%
1 ene 1995 año
111.328
-0.066
-0.06%
1 ene 1996 año
111.016
-0.313
-0.28%
1 ene 1997 año
110.372
-0.644
-0.58%
1 ene 1998 año
109.395
-0.977
-0.89%
1 ene 1999 año
108.215
-1.18
-1.08%
1 ene 2000 año
107.505
-0.71
-0.66%
1 ene 2001 año
107.039
-0.466
-0.43%
1 ene 2002 año
106.479
-0.56
-0.52%
1 ene 2003 año
106.267
-0.213
-0.2%
1 ene 2004 año
105.865
-0.402
-0.38%
1 ene 2005 año
104.814
-1.05
-0.99%
1 ene 2006 año
103.83
-0.984
-0.94%
1 ene 2007 año
102.577
-1.252
-1.21%
1 ene 2008 año
102.427
-0.15
-0.15%
1 ene 2009 año
102.62
+0.193
0.19%
1 ene 2010 año
103.598
+0.978
0.95%
1 ene 2011 año
103.971
+0.373
0.36%
1 ene 2012 año
104.507
+0.536
0.52%
1 ene 2013 año
105.013
+0.506
0.48%
1 ene 2014 año
104.65
-0.363
-0.35%
1 ene 2015 año
103.615
-1.035
-0.99%
Ranking de los países por los datos estadísticos actuales


Comentarios: