29
/es/
es
AIzaSyAYiBZKx7MnpbEhh9jyipgxe19OcubqV5w
April 1, 2024
266313
Tonga
TON
true
2
1
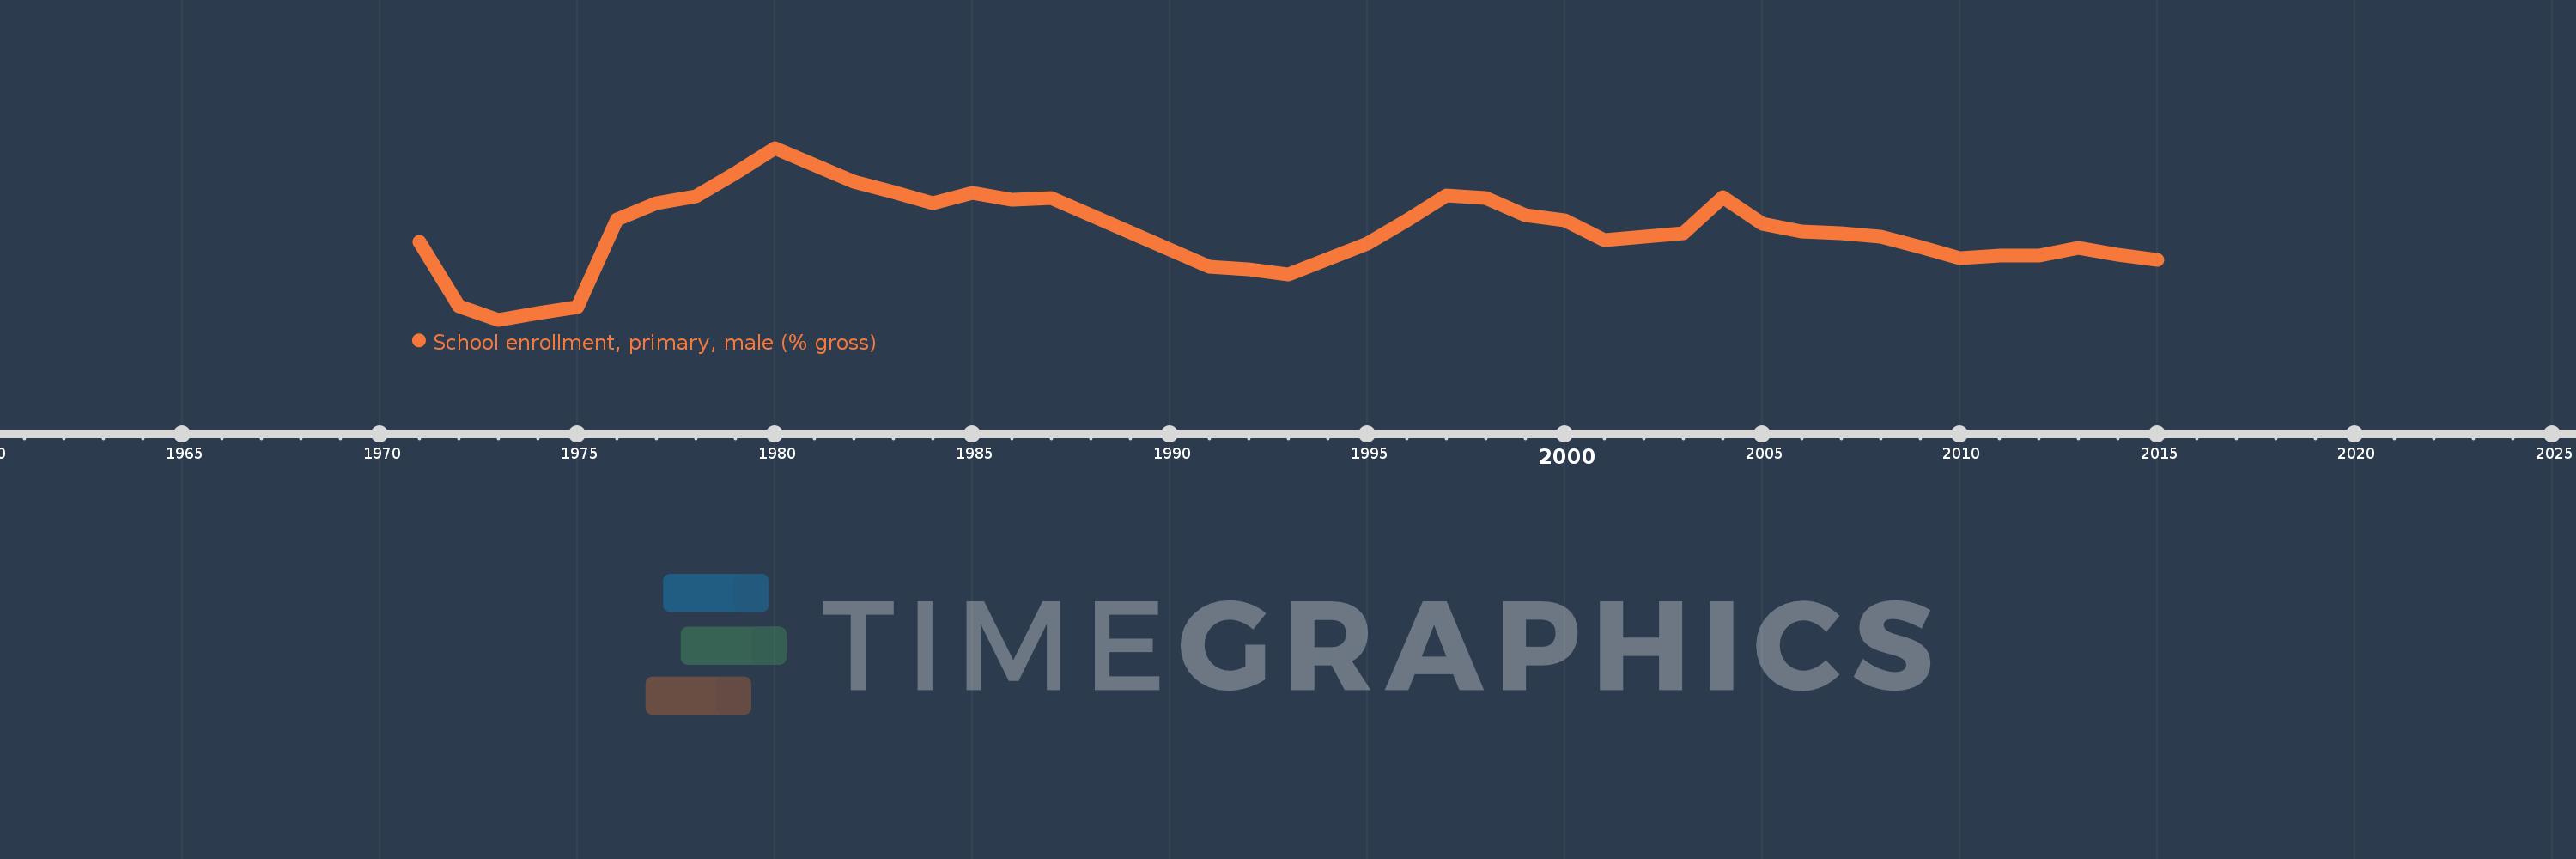
School enrollment, primary, male (% gross)
2015,2014,2013,2012,2011,2010,2009,2008,2007,2006,2005,2004,2003,2002,2001,2000,1999,1998,1997,1996,1995,1994,1993,1992,1991,1987,1986,1985,1984,1983,1982,1980,1979,1978,1977,1976,1975,1974,1973,1972,1971
Estas estadísticas en otros países:
AfghanistanAlbaniaAlgeriaAndorraAngolaAntigua and BarbudaArab WorldArgentinaArmeniaArubaAustraliaAustriaAzerbaijanBahamas, TheBahrainBangladeshBarbadosBelarusBelgiumBelizeBeninBermudaBhutanBoliviaBosnia and HerzegovinaBotswanaBrazilBrunei DarussalamBulgariaBurkina FasoBurundiCabo VerdeCambodiaCameroonCanadaCaribbean small statesCentral African RepublicCentral Europe and the BalticsChadChileChinaColombiaComorosCongo, Dem. Rep.Congo, Rep.Costa RicaCote d'IvoireCroatiaCubaCuracaoCyprusCzech RepublicDenmarkDjiboutiDominicaDominican RepublicEarly-demographic dividendEast Asia & PacificEast Asia & Pacific (excluding high income)East Asia & Pacific (IDA & IBRD countries)EcuadorEgypt, Arab Rep.El SalvadorEquatorial GuineaEritreaEstoniaEthiopiaEuro areaEurope & Central AsiaEurope & Central Asia (excluding high income)Europe & Central Asia (IDA & IBRD countries)European UnionFijiFinlandFragile and conflict affected situationsFranceGabonGambia, TheGeorgiaGermanyGhanaGreeceGrenadaGuatemalaGuineaGuinea-BissauGuyanaHaitiHeavily indebted poor countries (HIPC)High incomeHondurasHong Kong SAR, ChinaHungaryIBRD onlyIcelandIDA & IBRD totalIDA blendIDA onlyIDA totalIndiaIndonesiaIran, Islamic Rep.IraqIrelandIsraelItalyJamaicaJapanJordanKazakhstanKenyaKiribatiKorea, Dem. People’s Rep.Korea, Rep.KuwaitKyrgyz RepublicLao PDRLate-demographic dividendLatin America & Caribbean Latin America & Caribbean (excluding high income)Latin America & the Caribbean (IDA & IBRD countries)LatviaLeast developed countries: UN classificationLebanonLesothoLiberiaLibyaLiechtensteinLithuaniaLow & middle incomeLow incomeLower middle incomeLuxembourgMacao SAR, ChinaMacedonia, FYRMadagascarMalawiMaldivesMaliMaltaMarshall IslandsMauritaniaMauritiusMexicoMicronesia, Fed. Sts.Middle East & North AfricaMiddle East & North Africa (excluding high income)Middle East & North Africa (IDA & IBRD countries)Middle incomeMoldovaMongoliaMontenegroMoroccoMozambiqueMyanmarNamibiaNauruNepalNetherlandsNew ZealandNicaraguaNigerNigeriaNorth AmericaNorwayOECD membersOmanOther small statesPacific island small statesPakistanPalauPanamaPapua New GuineaParaguayPeruPhilippinesPolandPortugalPost-demographic dividendPre-demographic dividendPuerto RicoQatarRomaniaRussian FederationRwandaSamoaSan MarinoSao Tome and PrincipeSaudi ArabiaSenegalSerbiaSeychellesSierra LeoneSlovak RepublicSloveniaSmall statesSolomon IslandsSomaliaSouth AfricaSouth AsiaSouth Asia (IDA & IBRD)South SudanSpainSri LankaSt. Kitts and NevisSt. LuciaSt. Vincent and the GrenadinesSub-Saharan Africa Sub-Saharan Africa (excluding high income)Sub-Saharan Africa (IDA & IBRD countries)SudanSurinameSwazilandSwedenSwitzerlandSyrian Arab RepublicTajikistanTanzaniaThailandTimor-LesteTogoTongaTrinidad and TobagoTunisiaTurkeyTurkmenistanTuvaluUgandaUkraineUnited Arab EmiratesUnited KingdomUnited StatesUpper middle incomeUruguayUzbekistanVanuatuVenezuela, RBVietnamWest Bank and GazaWorldYemen, Rep.ZambiaZimbabwe línea de tiempo (timeline):
En esta escala de tiempo se presenta un gráfico de 1971 y 2015 de Tonga. Los datos de 1970 están ausentes. El número de observaciones reales por fecha: 41.
Fuente (nombre):
Indicadores del desarrollo mundial
Fuente (organización):
United Nations Educational, Scientific, and Cultural Organization (UNESCO) Institute for Statistics.
Categorías:
Education, Gender
Se ha actualizado:
23 abr 2017 año
Los indicadores de los cambios de valor en los últimos años
Mínimo:
98.299
1 ene 1973 año
Máximo:
127.99
1 ene 1980 año
A la fecha de observación
Valor
Cambio absoluto
El cambio con respecto al valor anterior
1 ene 1971 año
111.728
+111.728
0.0%
1 ene 1972 año
100.664
-11.064
-9.9%
1 ene 1973 año
98.299
-2.365
-2.35%
1 ene 1974 año
99.469
+1.169
1.19%
1 ene 1975 año
100.487
+1.019
1.02%
1 ene 1976 año
115.642
+15.155
15.08%
1 ene 1977 año
118.454
+2.811
2.43%
1 ene 1978 año
119.681
+1.227
1.04%
1 ene 1979 año
123.592
+3.912
3.27%
1 ene 1980 año
127.99
+4.397
3.56%
1 ene 1982 año
122.124
-5.866
-4.58%
1 ene 1983 año
120.366
-1.758
-1.44%
1 ene 1984 año
118.453
-1.913
-1.59%
1 ene 1985 año
120.258
+1.804
1.52%
1 ene 1986 año
118.998
-1.26
-1.05%
1 ene 1987 año
119.277
+0.28
0.24%
1 ene 1991 año
107.493
-11.784
-9.88%
1 ene 1992 año
107.027
-0.467
-0.43%
1 ene 1993 año
106.112
-0.915
-0.85%
1 ene 1994 año
108.765
+2.653
2.5%
1 ene 1995 año
111.528
+2.763
2.54%
1 ene 1996 año
115.403
+3.874
3.47%
1 ene 1997 año
119.849
+4.446
3.85%
1 ene 1998 año
119.409
-0.44
-0.37%
1 ene 1999 año
116.356
-3.053
-2.56%
1 ene 2000 año
115.478
-0.877
-0.75%
1 ene 2001 año
112.133
-3.345
-2.9%
1 ene 2002 año
112.583
+0.45
0.4%
1 ene 2003 año
113.223
+0.64
0.57%
1 ene 2004 año
119.462
+6.238
5.51%
1 ene 2005 año
114.902
-4.56
-3.82%
1 ene 2006 año
113.591
-1.31
-1.14%
1 ene 2007 año
113.306
-0.285
-0.25%
1 ene 2008 año
112.624
-0.682
-0.6%
1 ene 2009 año
110.874
-1.75
-1.55%
1 ene 2010 año
108.894
-1.98
-1.79%
1 ene 2011 año
109.332
+0.438
0.4%
1 ene 2012 año
109.402
+0.07
0.06%
1 ene 2013 año
110.66
+1.258
1.15%
1 ene 2014 año
109.603
-1.058
-0.96%
1 ene 2015 año
108.635
-0.968
-0.88%
Ranking de los países por los datos estadísticos actuales


Comentarios: