29
/es/
es
AIzaSyAYiBZKx7MnpbEhh9jyipgxe19OcubqV5w
April 1, 2024
274023
Ukraine
UKR
true
2
1
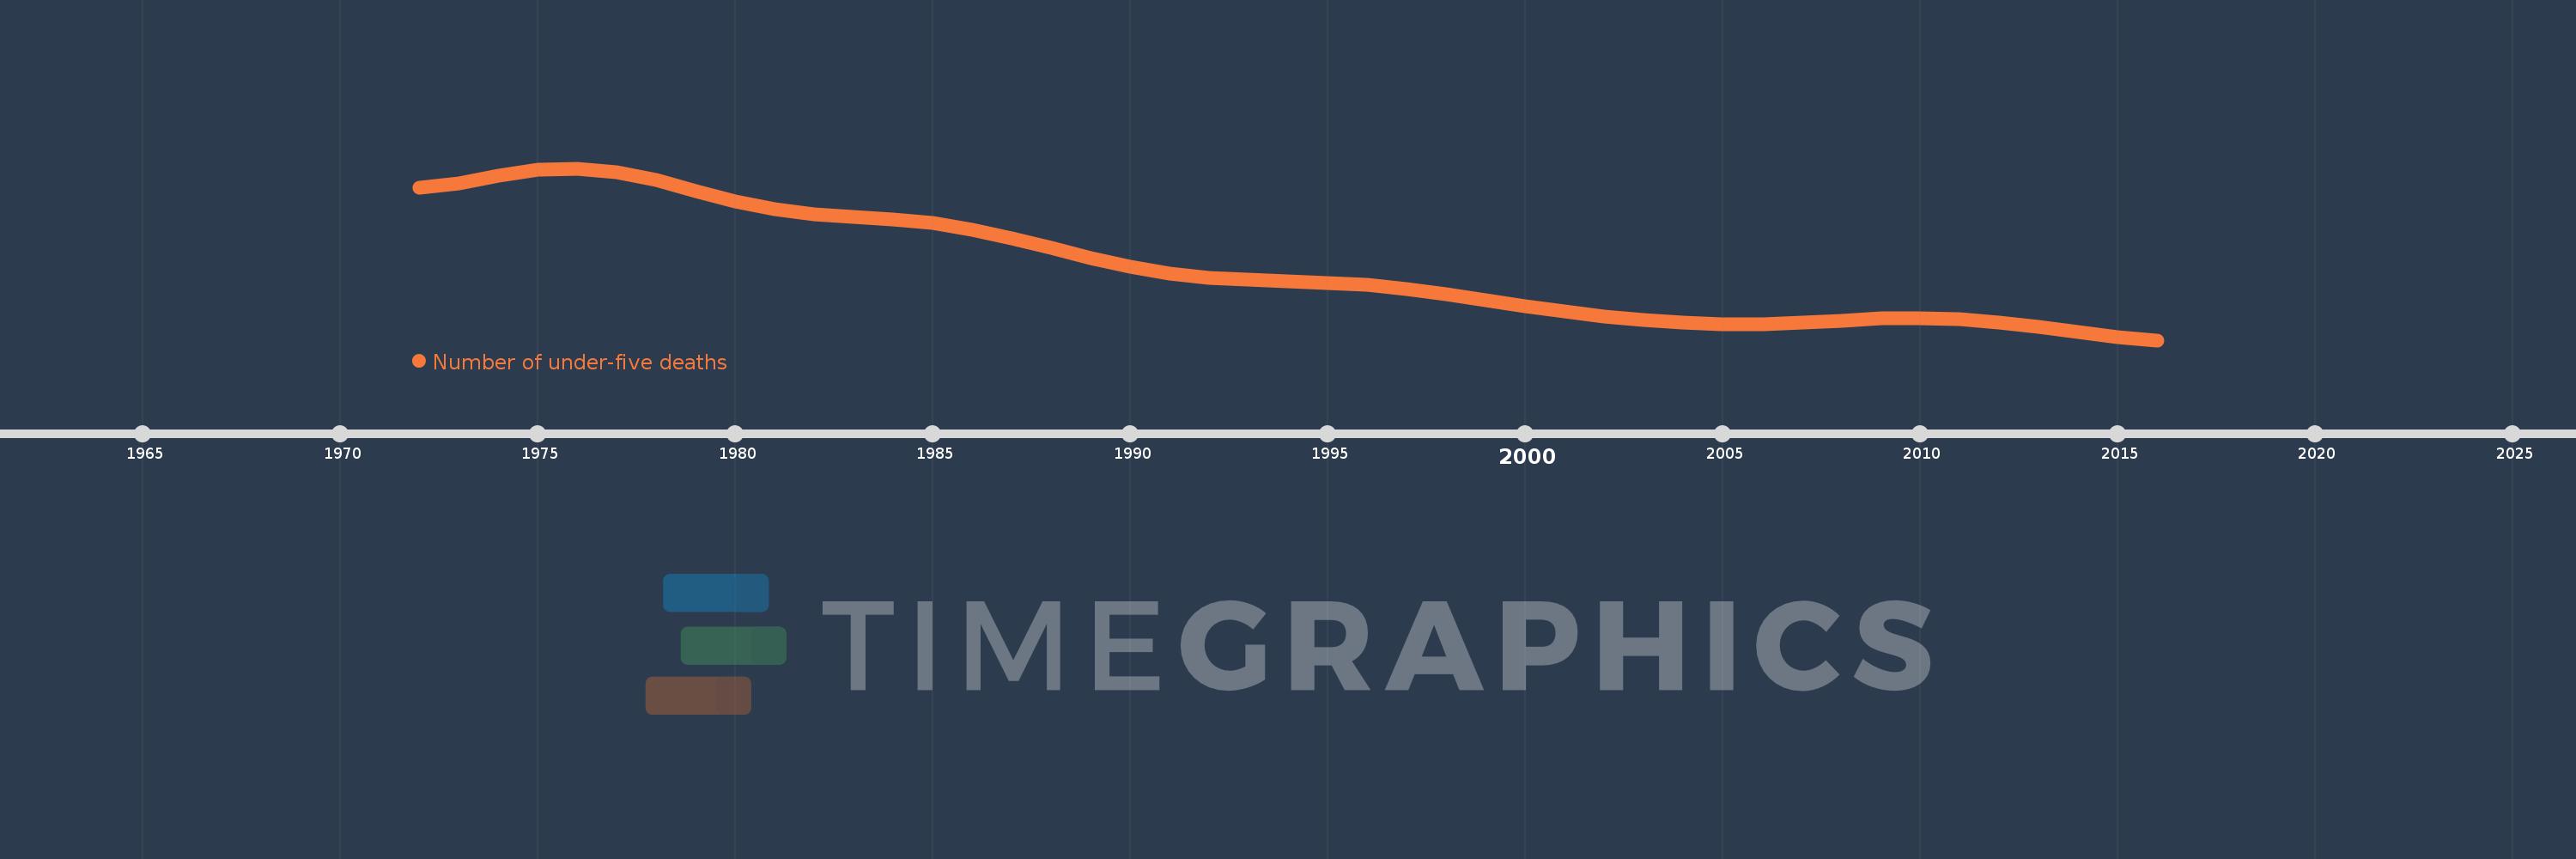
Number of under-five deaths
2016,2015,2014,2013,2012,2011,2010,2009,2008,2007,2006,2005,2004,2003,2002,2001,2000,1999,1998,1997,1996,1995,1994,1993,1992,1991,1990,1989,1988,1987,1986,1985,1984,1983,1982,1981,1980,1979,1978,1977,1976,1975,1974,1973,1972
Estas estadísticas en otros países:
AfghanistanAlbaniaAlgeriaAndorraAngolaAntigua and BarbudaArgentinaArmeniaAustraliaAustriaAzerbaijanBahamas, TheBahrainBangladeshBarbadosBelarusBelgiumBelizeBeninBhutanBoliviaBosnia and HerzegovinaBotswanaBrazilBrunei DarussalamBulgariaBurkina FasoBurundiCabo VerdeCambodiaCameroonCanadaCentral African RepublicChadChileChinaColombiaComorosCongo, Dem. Rep.Congo, Rep.Costa RicaCote d'IvoireCroatiaCubaCyprusCzech RepublicDenmarkDjiboutiDominicaDominican RepublicEast Asia & Pacific (excluding high income)EcuadorEgypt, Arab Rep.El SalvadorEquatorial GuineaEritreaEstoniaEthiopiaEurope & Central Asia (excluding high income)FijiFinlandFranceGabonGambia, TheGeorgiaGermanyGhanaGreeceGrenadaGuatemalaGuineaGuinea-BissauGuyanaHaitiHigh incomeHondurasHungaryIcelandIndiaIndonesiaIran, Islamic Rep.IraqIrelandIsraelItalyJamaicaJapanJordanKazakhstanKenyaKiribatiKorea, Dem. People’s Rep.Korea, Rep.KuwaitKyrgyz RepublicLao PDRLatin America & Caribbean (excluding high income)LatviaLebanonLesothoLiberiaLibyaLithuaniaLow & middle incomeLow incomeLower middle incomeLuxembourgMacedonia, FYRMadagascarMalawiMalaysiaMaldivesMaliMaltaMarshall IslandsMauritaniaMauritiusMexicoMicronesia, Fed. Sts.Middle East & North Africa (excluding high income)Middle incomeMoldovaMonacoMongoliaMontenegroMoroccoMozambiqueMyanmarNamibiaNauruNepalNetherlandsNew ZealandNicaraguaNigerNigeriaNorwayOmanPakistanPalauPanamaPapua New GuineaParaguayPeruPhilippinesPolandPortugalQatarRomaniaRussian FederationRwandaSamoaSan MarinoSao Tome and PrincipeSaudi ArabiaSenegalSerbiaSeychellesSierra LeoneSingaporeSlovak RepublicSloveniaSolomon IslandsSomaliaSouth AfricaSouth AsiaSouth SudanSpainSri LankaSt. Kitts and NevisSt. LuciaSt. Vincent and the GrenadinesSub-Saharan Africa (excluding high income)SudanSurinameSwazilandSwedenSwitzerlandSyrian Arab RepublicTajikistanTanzaniaThailandTimor-LesteTogoTongaTrinidad and TobagoTunisiaTurkeyTurkmenistanTuvaluUgandaUkraineUnited Arab EmiratesUnited KingdomUnited StatesUpper middle incomeUruguayUzbekistanVanuatuVenezuela, RBVietnamWest Bank and GazaWorldYemen, Rep.ZambiaZimbabwe línea de tiempo (timeline):
En esta escala de tiempo se presenta un gráfico de 1972 y 2016 de Ukraine. Los datos de 1971 están ausentes. El número de observaciones reales por fecha: 45.
Fuente (nombre):
Indicadores del desarrollo mundial
Fuente (organización):
Estimates developed by the UN Inter-agency Group for Child Mortality Estimation (UNICEF, WHO, World Bank, UN DESA Population Division) at www.childmortality.org.
Categorías:
Health
Se ha actualizado:
23 abr 2017 año
Los indicadores de los cambios de valor en los últimos años
Mínimo:
3.997 mil
1 ene 2016 año
Máximo:
25.252 mil
1 ene 1976 año
A la fecha de observación
Valor
Cambio absoluto
El cambio con respecto al valor anterior
1 ene 1972 año
22.851 mil
+22.851 mil
0.0%
1 ene 1973 año
23.373 mil
+522.0
2.28%
1 ene 1974 año
24.352 mil
+979.0
4.19%
1 ene 1975 año
25.077 mil
+725.0
2.98%
1 ene 1976 año
25.252 mil
+175.0
0.7%
1 ene 1977 año
24.82 mil
-432.0
-1.71%
1 ene 1978 año
23.853 mil
-967.0
-3.9%
1 ene 1979 año
22.441 mil
-1.412 mil
-5.92%
1 ene 1980 año
21.135 mil
-1.306 mil
-5.82%
1 ene 1981 año
20.175 mil
-960.0
-4.54%
1 ene 1982 año
19.55 mil
-625.0
-3.1%
1 ene 1983 año
19.207 mil
-343.0
-1.75%
1 ene 1984 año
18.921 mil
-286.0
-1.49%
1 ene 1985 año
18.545 mil
-376.0
-1.99%
1 ene 1986 año
17.675 mil
-870.0
-4.69%
1 ene 1987 año
16.635 mil
-1.04 mil
-5.88%
1 ene 1988 año
15.413 mil
-1.222 mil
-7.35%
1 ene 1989 año
14.138 mil
-1.275 mil
-8.27%
1 ene 1990 año
13.038 mil
-1.1 mil
-7.78%
1 ene 1991 año
12.203 mil
-835.0
-6.4%
1 ene 1992 año
11.721 mil
-482.0
-3.95%
1 ene 1993 año
11.478 mil
-243.0
-2.07%
1 ene 1994 año
11.285 mil
-193.0
-1.68%
1 ene 1995 año
11.115 mil
-170.0
-1.51%
1 ene 1996 año
10.851 mil
-264.0
-2.38%
1 ene 1997 año
10.353 mil
-498.0
-4.59%
1 ene 1998 año
9.696 mil
-657.0
-6.35%
1 ene 1999 año
8.957 mil
-739.0
-7.62%
1 ene 2000 año
8.17 mil
-787.0
-8.79%
1 ene 2001 año
7.543 mil
-627.0
-7.67%
1 ene 2002 año
6.953 mil
-590.0
-7.82%
1 ene 2003 año
6.481 mil
-472.0
-6.79%
1 ene 2004 año
6.171 mil
-310.0
-4.78%
1 ene 2005 año
5.989 mil
-182.0
-2.95%
1 ene 2006 año
6.008 mil
+19.0
0.32%
1 ene 2007 año
6.176 mil
+168.0
2.8%
1 ene 2008 año
6.411 mil
+235.0
3.81%
1 ene 2009 año
6.66 mil
+249.0
3.88%
1 ene 2010 año
6.712 mil
+52.0
0.78%
1 ene 2011 año
6.588 mil
-124.0
-1.85%
1 ene 2012 año
6.208 mil
-380.0
-5.77%
1 ene 2013 año
5.628 mil
-580.0
-9.34%
1 ene 2014 año
4.968 mil
-660.0
-11.73%
1 ene 2015 año
4.418 mil
-550.0
-11.07%
1 ene 2016 año
3.997 mil
-421.0
-9.53%
Ranking de los países por los datos estadísticos actuales


Comentarios: