29
/es/
es
AIzaSyAYiBZKx7MnpbEhh9jyipgxe19OcubqV5w
April 1, 2024
119237
Denmark
DNK
true
2
1
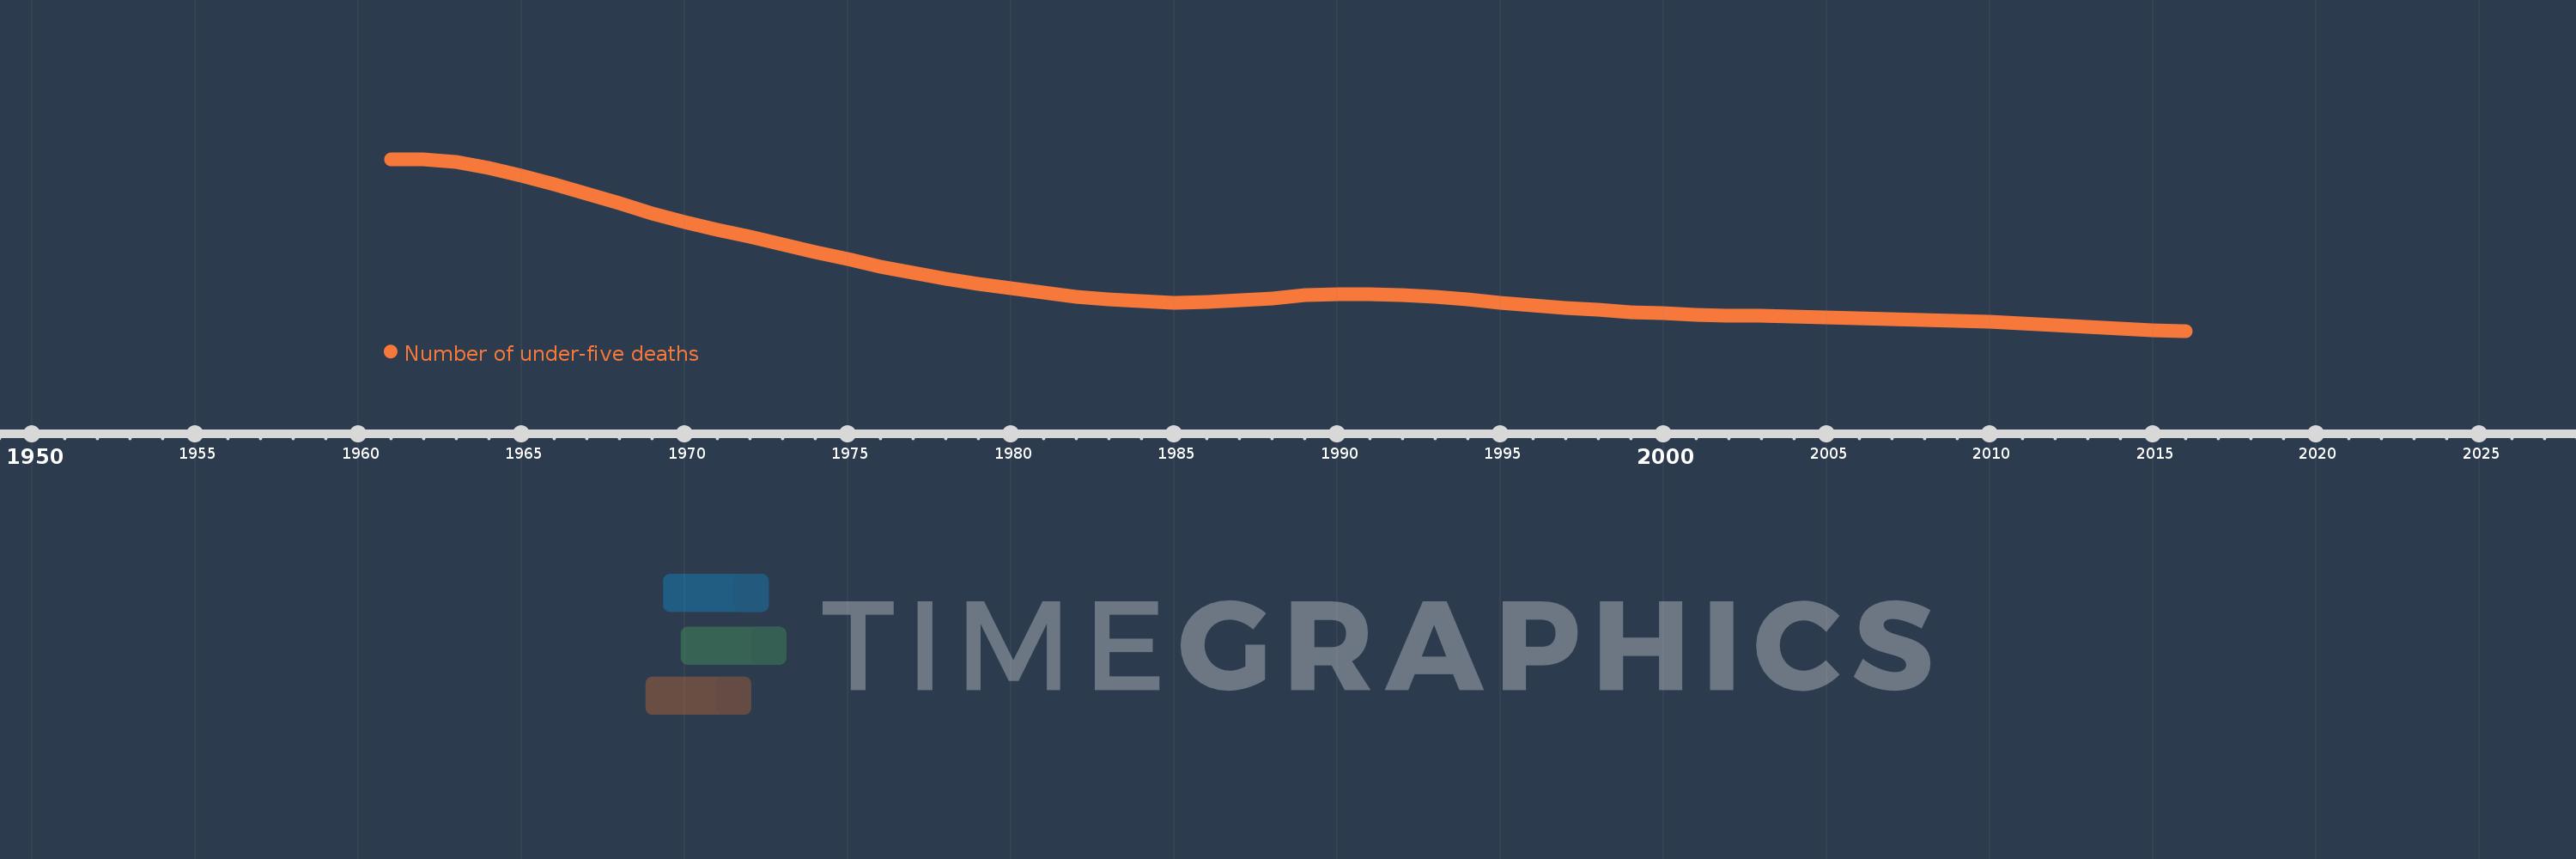
Number of under-five deaths
2016,2015,2014,2013,2012,2011,2010,2009,2008,2007,2006,2005,2004,2003,2002,2001,2000,1999,1998,1997,1996,1995,1994,1993,1992,1991,1990,1989,1988,1987,1986,1985,1984,1983,1982,1981,1980,1979,1978,1977,1976,1975,1974,1973,1972,1971,1970,1969,1968,1967,1966,1965,1964,1963,1962,1961
Estas estadísticas en otros países:
AfghanistanAlbaniaAlgeriaAndorraAngolaAntigua and BarbudaArgentinaArmeniaAustraliaAustriaAzerbaijanBahamas, TheBahrainBangladeshBarbadosBelarusBelgiumBelizeBeninBhutanBoliviaBosnia and HerzegovinaBotswanaBrazilBrunei DarussalamBulgariaBurkina FasoBurundiCabo VerdeCambodiaCameroonCanadaCentral African RepublicChadChileChinaColombiaComorosCongo, Dem. Rep.Congo, Rep.Costa RicaCote d'IvoireCroatiaCubaCyprusCzech RepublicDenmarkDjiboutiDominicaDominican RepublicEast Asia & Pacific (excluding high income)EcuadorEgypt, Arab Rep.El SalvadorEquatorial GuineaEritreaEstoniaEthiopiaEurope & Central Asia (excluding high income)FijiFinlandFranceGabonGambia, TheGeorgiaGermanyGhanaGreeceGrenadaGuatemalaGuineaGuinea-BissauGuyanaHaitiHigh incomeHondurasHungaryIcelandIndiaIndonesiaIran, Islamic Rep.IraqIrelandIsraelItalyJamaicaJapanJordanKazakhstanKenyaKiribatiKorea, Dem. People’s Rep.Korea, Rep.KuwaitKyrgyz RepublicLao PDRLatin America & Caribbean (excluding high income)LatviaLebanonLesothoLiberiaLibyaLithuaniaLow & middle incomeLow incomeLower middle incomeLuxembourgMacedonia, FYRMadagascarMalawiMalaysiaMaldivesMaliMaltaMarshall IslandsMauritaniaMauritiusMexicoMicronesia, Fed. Sts.Middle East & North Africa (excluding high income)Middle incomeMoldovaMonacoMongoliaMontenegroMoroccoMozambiqueMyanmarNamibiaNauruNepalNetherlandsNew ZealandNicaraguaNigerNigeriaNorwayOmanPakistanPalauPanamaPapua New GuineaParaguayPeruPhilippinesPolandPortugalQatarRomaniaRussian FederationRwandaSamoaSan MarinoSao Tome and PrincipeSaudi ArabiaSenegalSerbiaSeychellesSierra LeoneSingaporeSlovak RepublicSloveniaSolomon IslandsSomaliaSouth AfricaSouth AsiaSouth SudanSpainSri LankaSt. Kitts and NevisSt. LuciaSt. Vincent and the GrenadinesSub-Saharan Africa (excluding high income)SudanSurinameSwazilandSwedenSwitzerlandSyrian Arab RepublicTajikistanTanzaniaThailandTimor-LesteTogoTongaTrinidad and TobagoTunisiaTurkeyTurkmenistanTuvaluUgandaUkraineUnited Arab EmiratesUnited KingdomUnited StatesUpper middle incomeUruguayUzbekistanVanuatuVenezuela, RBVietnamWest Bank and GazaWorldYemen, Rep.ZambiaZimbabwe línea de tiempo (timeline):
En esta escala de tiempo se presenta un gráfico de 1961 y 2016 de Denmark. Los datos de 1960 están ausentes. El número de observaciones reales por fecha: 56.
Fuente (nombre):
Indicadores del desarrollo mundial
Fuente (organización):
Estimates developed by the UN Inter-agency Group for Child Mortality Estimation (UNICEF, WHO, World Bank, UN DESA Population Division) at www.childmortality.org.
Categorías:
Health
Se ha actualizado:
23 abr 2017 año
Los indicadores de los cambios de valor en los últimos años
Mínimo:
187.0
1 ene 2016 año
Máximo:
1.997 mil
1 ene 1962 año
A la fecha de observación
Valor
Cambio absoluto
El cambio con respecto al valor anterior
1 ene 1961 año
1.995 mil
+1.995 mil
0.0%
1 ene 1962 año
1.997 mil
+2.0
0.1%
1 ene 1963 año
1.964 mil
-33.0
-1.65%
1 ene 1964 año
1.905 mil
-59.0
-3.0%
1 ene 1965 año
1.826 mil
-79.0
-4.15%
1 ene 1966 año
1.733 mil
-93.0
-5.09%
1 ene 1967 año
1.635 mil
-98.0
-5.65%
1 ene 1968 año
1.529 mil
-106.0
-6.48%
1 ene 1969 año
1.42 mil
-109.0
-7.13%
1 ene 1970 año
1.338 mil
-82.0
-5.77%
1 ene 1971 año
1.254 mil
-84.0
-6.28%
1 ene 1972 año
1.176 mil
-78.0
-6.22%
1 ene 1973 año
1.097 mil
-79.0
-6.72%
1 ene 1974 año
1.013 mil
-84.0
-7.66%
1 ene 1975 año
943.0
-70.0
-6.91%
1 ene 1976 año
867.0
-76.0
-8.06%
1 ene 1977 año
796.0
-71.0
-8.19%
1 ene 1978 año
738.0
-58.0
-7.29%
1 ene 1979 año
679.0
-59.0
-7.99%
1 ene 1980 año
633.0
-46.0
-6.77%
1 ene 1981 año
589.0
-44.0
-6.95%
1 ene 1982 año
547.0
-42.0
-7.13%
1 ene 1983 año
517.0
-30.0
-5.48%
1 ene 1984 año
497.0
-20.0
-3.87%
1 ene 1985 año
486.0
-11.0
-2.21%
1 ene 1986 año
493.0
+7.0
1.44%
1 ene 1987 año
506.0
+13.0
2.64%
1 ene 1988 año
532.0
+26.0
5.14%
1 ene 1989 año
560.0
+28.0
5.26%
1 ene 1990 año
575.0
+15.0
2.68%
1 ene 1991 año
575.0
0.0
0.0%
1 ene 1992 año
563.0
-12.0
-2.09%
1 ene 1993 año
542.0
-21.0
-3.73%
1 ene 1994 año
515.0
-27.0
-4.98%
1 ene 1995 año
482.0
-33.0
-6.41%
1 ene 1996 año
454.0
-28.0
-5.81%
1 ene 1997 año
429.0
-25.0
-5.51%
1 ene 1998 año
408.0
-21.0
-4.9%
1 ene 1999 año
386.0
-22.0
-5.39%
1 ene 2000 año
371.0
-15.0
-3.89%
1 ene 2001 año
359.0
-12.0
-3.23%
1 ene 2002 año
350.0
-9.0
-2.51%
1 ene 2003 año
343.0
-7.0
-2.0%
1 ene 2004 año
338.0
-5.0
-1.46%
1 ene 2005 año
329.0
-9.0
-2.66%
1 ene 2006 año
319.0
-10.0
-3.04%
1 ene 2007 año
309.0
-10.0
-3.13%
1 ene 2008 año
300.0
-9.0
-2.91%
1 ene 2009 año
289.0
-11.0
-3.67%
1 ene 2010 año
282.0
-7.0
-2.42%
1 ene 2011 año
265.0
-17.0
-6.03%
1 ene 2012 año
250.0
-15.0
-5.66%
1 ene 2013 año
231.0
-19.0
-7.6%
1 ene 2014 año
211.0
-20.0
-8.66%
1 ene 2015 año
196.0
-15.0
-7.11%
1 ene 2016 año
187.0
-9.0
-4.59%
Ranking de los países por los datos estadísticos actuales


Comentarios: