29
/es/
es
AIzaSyAYiBZKx7MnpbEhh9jyipgxe19OcubqV5w
April 1, 2024
152906
Hungary
HUN
true
2
1
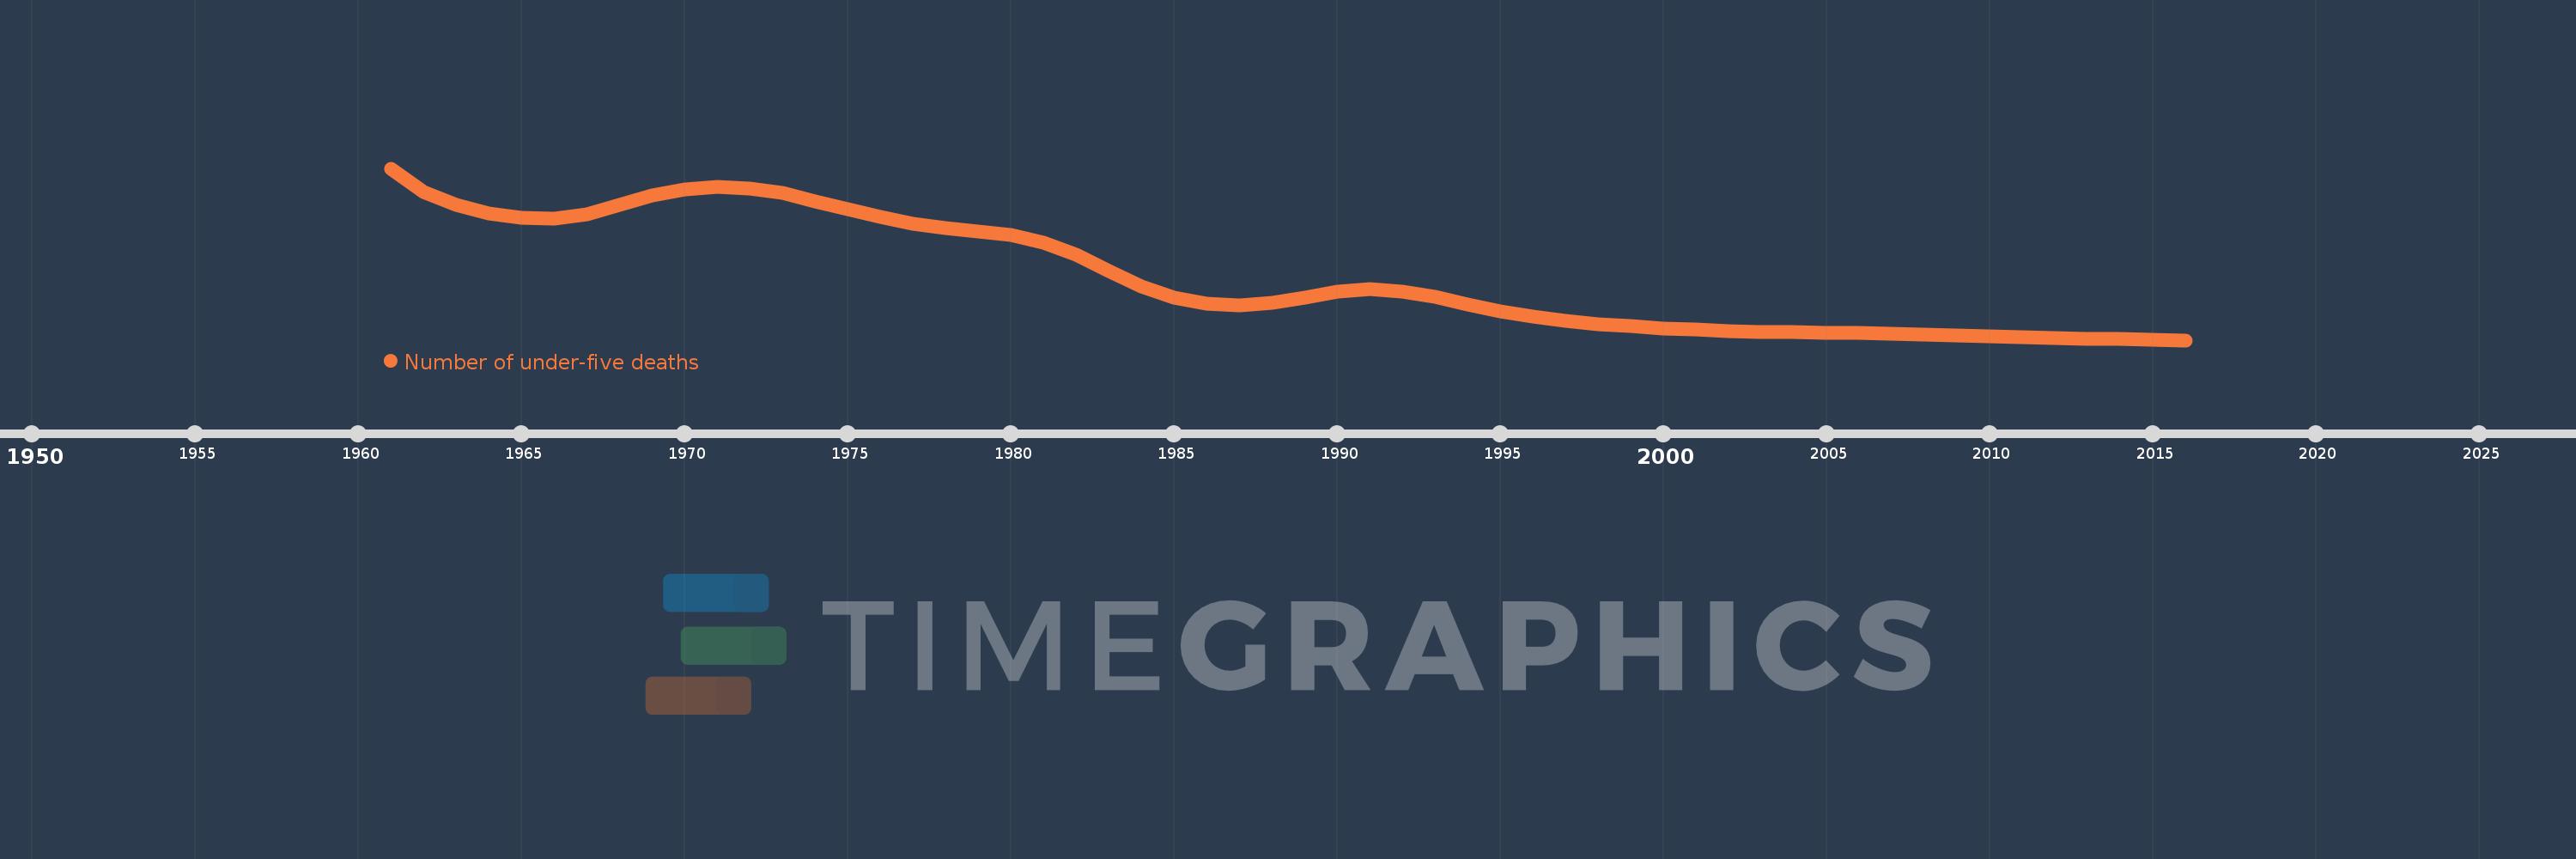
Number of under-five deaths
2016,2015,2014,2013,2012,2011,2010,2009,2008,2007,2006,2005,2004,2003,2002,2001,2000,1999,1998,1997,1996,1995,1994,1993,1992,1991,1990,1989,1988,1987,1986,1985,1984,1983,1982,1981,1980,1979,1978,1977,1976,1975,1974,1973,1972,1971,1970,1969,1968,1967,1966,1965,1964,1963,1962,1961
Estas estadísticas en otros países:
AfghanistanAlbaniaAlgeriaAndorraAngolaAntigua and BarbudaArgentinaArmeniaAustraliaAustriaAzerbaijanBahamas, TheBahrainBangladeshBarbadosBelarusBelgiumBelizeBeninBhutanBoliviaBosnia and HerzegovinaBotswanaBrazilBrunei DarussalamBulgariaBurkina FasoBurundiCabo VerdeCambodiaCameroonCanadaCentral African RepublicChadChileChinaColombiaComorosCongo, Dem. Rep.Congo, Rep.Costa RicaCote d'IvoireCroatiaCubaCyprusCzech RepublicDenmarkDjiboutiDominicaDominican RepublicEast Asia & Pacific (excluding high income)EcuadorEgypt, Arab Rep.El SalvadorEquatorial GuineaEritreaEstoniaEthiopiaEurope & Central Asia (excluding high income)FijiFinlandFranceGabonGambia, TheGeorgiaGermanyGhanaGreeceGrenadaGuatemalaGuineaGuinea-BissauGuyanaHaitiHigh incomeHondurasHungaryIcelandIndiaIndonesiaIran, Islamic Rep.IraqIrelandIsraelItalyJamaicaJapanJordanKazakhstanKenyaKiribatiKorea, Dem. People’s Rep.Korea, Rep.KuwaitKyrgyz RepublicLao PDRLatin America & Caribbean (excluding high income)LatviaLebanonLesothoLiberiaLibyaLithuaniaLow & middle incomeLow incomeLower middle incomeLuxembourgMacedonia, FYRMadagascarMalawiMalaysiaMaldivesMaliMaltaMarshall IslandsMauritaniaMauritiusMexicoMicronesia, Fed. Sts.Middle East & North Africa (excluding high income)Middle incomeMoldovaMonacoMongoliaMontenegroMoroccoMozambiqueMyanmarNamibiaNauruNepalNetherlandsNew ZealandNicaraguaNigerNigeriaNorwayOmanPakistanPalauPanamaPapua New GuineaParaguayPeruPhilippinesPolandPortugalQatarRomaniaRussian FederationRwandaSamoaSan MarinoSao Tome and PrincipeSaudi ArabiaSenegalSerbiaSeychellesSierra LeoneSingaporeSlovak RepublicSloveniaSolomon IslandsSomaliaSouth AfricaSouth AsiaSouth SudanSpainSri LankaSt. Kitts and NevisSt. LuciaSt. Vincent and the GrenadinesSub-Saharan Africa (excluding high income)SudanSurinameSwazilandSwedenSwitzerlandSyrian Arab RepublicTajikistanTanzaniaThailandTimor-LesteTogoTongaTrinidad and TobagoTunisiaTurkeyTurkmenistanTuvaluUgandaUkraineUnited Arab EmiratesUnited KingdomUnited StatesUpper middle incomeUruguayUzbekistanVanuatuVenezuela, RBVietnamWest Bank and GazaWorldYemen, Rep.ZambiaZimbabwe línea de tiempo (timeline):
En esta escala de tiempo se presenta un gráfico de 1961 y 2016 de Hungary. Los datos de 1960 están ausentes. El número de observaciones reales por fecha: 56.
Fuente (nombre):
Indicadores del desarrollo mundial
Fuente (organización):
Estimates developed by the UN Inter-agency Group for Child Mortality Estimation (UNICEF, WHO, World Bank, UN DESA Population Division) at www.childmortality.org.
Categorías:
Health
Se ha actualizado:
23 abr 2017 año
Los indicadores de los cambios de valor en los últimos años
Mínimo:
518.0
1 ene 2016 año
Máximo:
8.312 mil
1 ene 1961 año
A la fecha de observación
Valor
Cambio absoluto
El cambio con respecto al valor anterior
1 ene 1961 año
8.312 mil
+8.312 mil
0.0%
1 ene 1962 año
7.255 mil
-1.057 mil
-12.72%
1 ene 1963 año
6.645 mil
-610.0
-8.41%
1 ene 1964 año
6.272 mil
-373.0
-5.61%
1 ene 1965 año
6.071 mil
-201.0
-3.2%
1 ene 1966 año
6.034 mil
-37.0
-0.61%
1 ene 1967 año
6.235 mil
+201.0
3.33%
1 ene 1968 año
6.637 mil
+402.0
6.45%
1 ene 1969 año
7.07 mil
+433.0
6.52%
1 ene 1970 año
7.354 mil
+284.0
4.02%
1 ene 1971 año
7.462 mil
+108.0
1.47%
1 ene 1972 año
7.411 mil
-51.0
-0.68%
1 ene 1973 año
7.182 mil
-229.0
-3.09%
1 ene 1974 año
6.831 mil
-351.0
-4.89%
1 ene 1975 año
6.46 mil
-371.0
-5.43%
1 ene 1976 año
6.11 mil
-350.0
-5.42%
1 ene 1977 año
5.806 mil
-304.0
-4.98%
1 ene 1978 año
5.585 mil
-221.0
-3.81%
1 ene 1979 año
5.447 mil
-138.0
-2.47%
1 ene 1980 año
5.28 mil
-167.0
-3.07%
1 ene 1981 año
4.949 mil
-331.0
-6.27%
1 ene 1982 año
4.393 mil
-556.0
-11.23%
1 ene 1983 año
3.664 mil
-729.0
-16.59%
1 ene 1984 año
2.955 mil
-709.0
-19.35%
1 ene 1985 año
2.45 mil
-505.0
-17.09%
1 ene 1986 año
2.185 mil
-265.0
-10.82%
1 ene 1987 año
2.102 mil
-83.0
-3.8%
1 ene 1988 año
2.219 mil
+117.0
5.57%
1 ene 1989 año
2.455 mil
+236.0
10.64%
1 ene 1990 año
2.709 mil
+254.0
10.35%
1 ene 1991 año
2.821 mil
+112.0
4.13%
1 ene 1992 año
2.735 mil
-86.0
-3.05%
1 ene 1993 año
2.487 mil
-248.0
-9.07%
1 ene 1994 año
2.141 mil
-346.0
-13.91%
1 ene 1995 año
1.816 mil
-325.0
-15.18%
1 ene 1996 año
1.573 mil
-243.0
-13.38%
1 ene 1997 año
1.39 mil
-183.0
-11.63%
1 ene 1998 año
1.248 mil
-142.0
-10.22%
1 ene 1999 año
1.142 mil
-106.0
-8.49%
1 ene 2000 año
1.052 mil
-90.0
-7.88%
1 ene 2001 año
988.0
-64.0
-6.08%
1 ene 2002 año
928.0
-60.0
-6.07%
1 ene 2003 año
891.0
-37.0
-3.99%
1 ene 2004 año
875.0
-16.0
-1.8%
1 ene 2005 año
861.0
-14.0
-1.6%
1 ene 2006 año
845.0
-16.0
-1.86%
1 ene 2007 año
815.0
-30.0
-3.55%
1 ene 2008 año
774.0
-41.0
-5.03%
1 ene 2009 año
735.0
-39.0
-5.04%
1 ene 2010 año
683.0
-52.0
-7.07%
1 ene 2011 año
650.0
-33.0
-4.83%
1 ene 2012 año
616.0
-34.0
-5.23%
1 ene 2013 año
590.0
-26.0
-4.22%
1 ene 2014 año
564.0
-26.0
-4.41%
1 ene 2015 año
543.0
-21.0
-3.72%
1 ene 2016 año
518.0
-25.0
-4.6%
Ranking de los países por los datos estadísticos actuales


Comentarios: