29
/es/
es
AIzaSyAYiBZKx7MnpbEhh9jyipgxe19OcubqV5w
April 1, 2024
27350
East Asia & Pacific
EAS
false
2
1
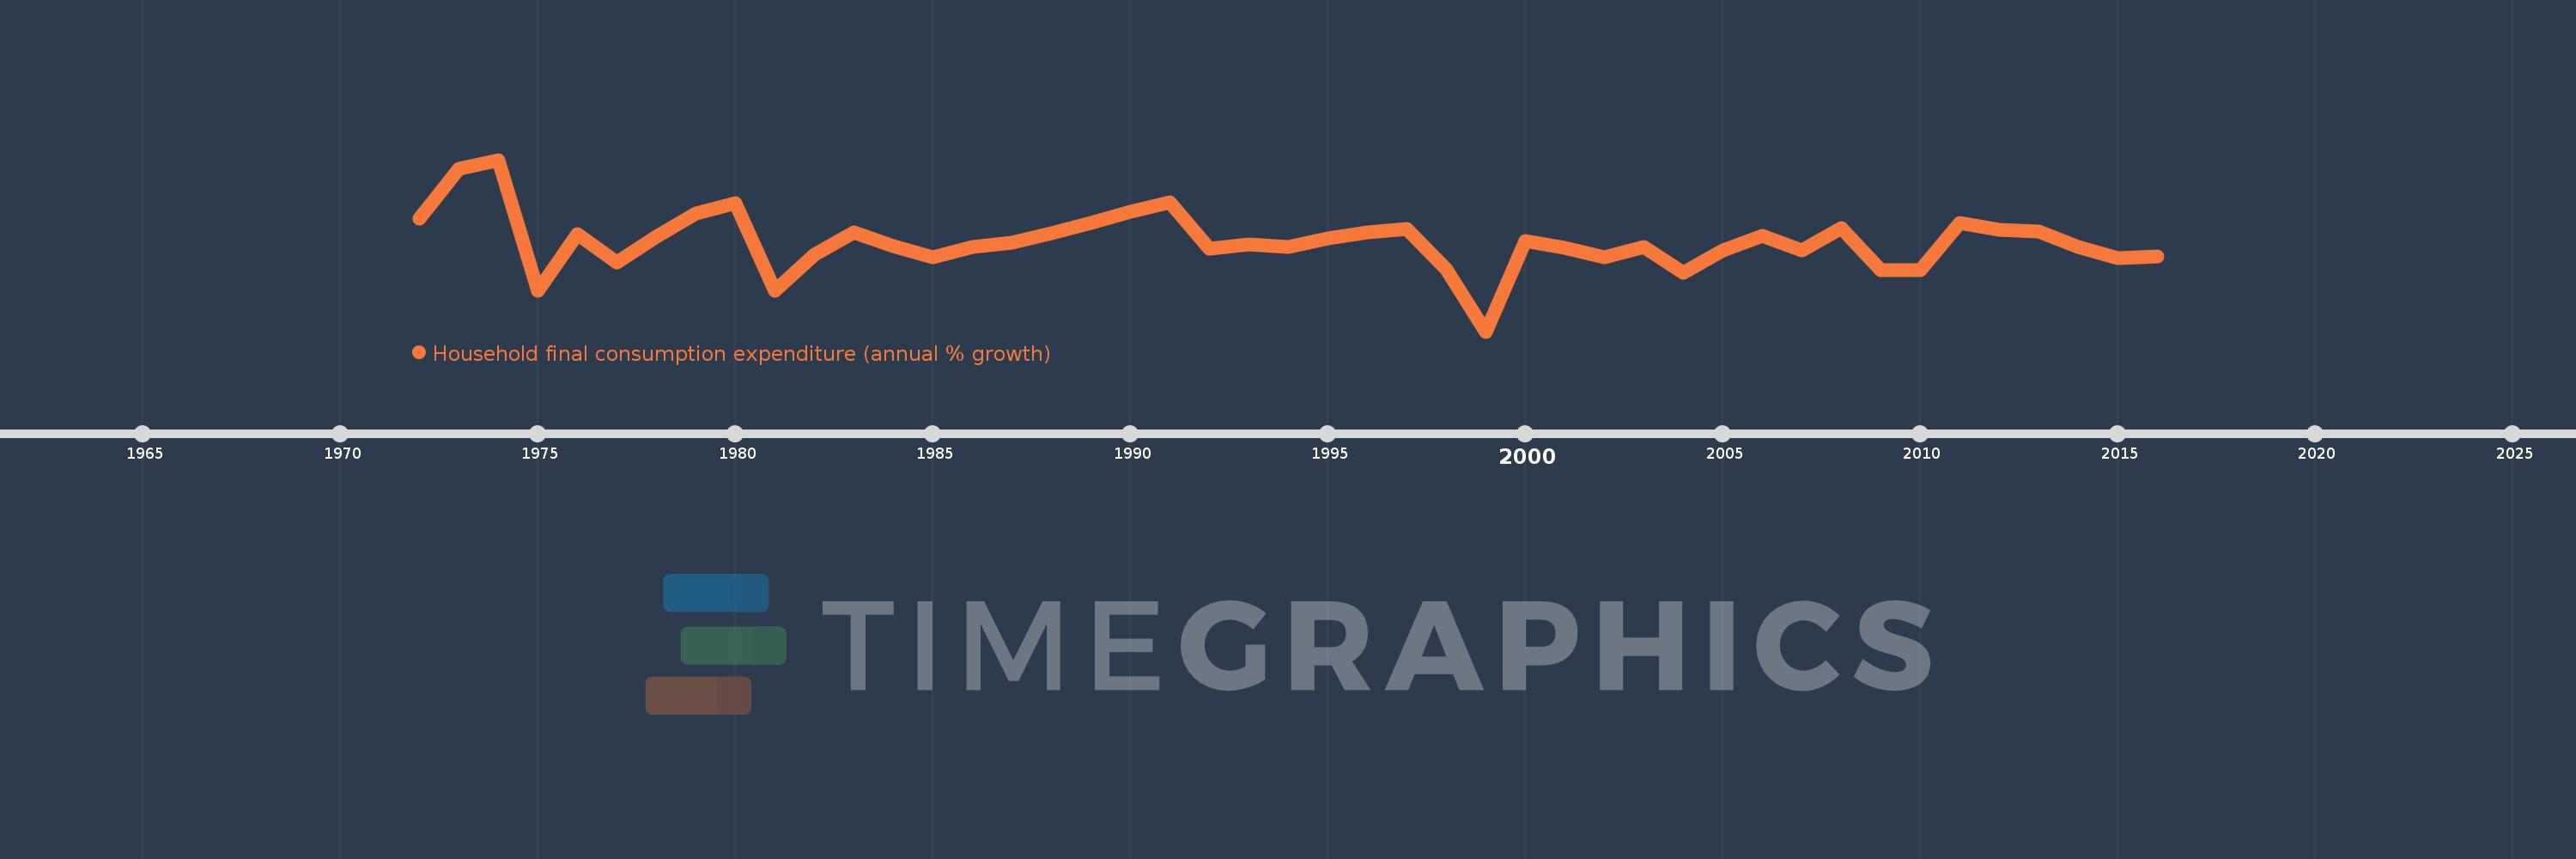
Household final consumption expenditure (annual % growth)
2016,2015,2014,2013,2012,2011,2010,2009,2008,2007,2006,2005,2004,2003,2002,2001,2000,1999,1998,1997,1996,1995,1994,1993,1992,1991,1990,1989,1988,1987,1986,1985,1984,1983,1982,1981,1980,1979,1978,1977,1976,1975,1974,1973,1972
Estas estadísticas en otros países:
AlbaniaAlgeriaAntigua and BarbudaArab WorldArgentinaArmeniaAustraliaAustriaAzerbaijanBahamas, TheBahrainBangladeshBarbadosBelarusBelgiumBelizeBeninBhutanBoliviaBosnia and HerzegovinaBotswanaBrazilBrunei DarussalamBulgariaBurkina FasoBurundiCabo VerdeCambodiaCameroonCanadaCaribbean small statesCentral Europe and the BalticsChadChileChinaColombiaComorosCongo, Dem. Rep.Congo, Rep.Costa RicaCote d'IvoireCroatiaCubaCyprusCzech RepublicDenmarkDominican RepublicEarly-demographic dividendEast Asia & PacificEast Asia & Pacific (excluding high income)East Asia & Pacific (IDA & IBRD countries)EcuadorEgypt, Arab Rep.El SalvadorEquatorial GuineaEritreaEstoniaEthiopiaEuro areaEurope & Central AsiaEurope & Central Asia (excluding high income)Europe & Central Asia (IDA & IBRD countries)European UnionFinlandFranceGabonGambia, TheGeorgiaGermanyGhanaGreeceGuatemalaGuineaGuinea-BissauHaitiHeavily indebted poor countries (HIPC)High incomeHondurasHong Kong SAR, ChinaHungaryIBRD onlyIcelandIDA & IBRD totalIDA blendIDA onlyIDA totalIndiaIndonesiaIran, Islamic Rep.IrelandIsraelItalyJamaicaJapanJordanKazakhstanKenyaKorea, Rep.KosovoKuwaitKyrgyz RepublicLao PDRLate-demographic dividendLatin America & Caribbean Latin America & Caribbean (excluding high income)Latin America & the Caribbean (IDA & IBRD countries)LatviaLeast developed countries: UN classificationLebanonLiberiaLithuaniaLow & middle incomeLow incomeLower middle incomeLuxembourgMacao SAR, ChinaMacedonia, FYRMadagascarMalawiMalaysiaMaliMaltaMauritaniaMauritiusMexicoMiddle East & North AfricaMiddle East & North Africa (excluding high income)Middle East & North Africa (IDA & IBRD countries)Middle incomeMoldovaMongoliaMontenegroMoroccoMozambiqueNamibiaNepalNetherlandsNew ZealandNicaraguaNigerNigeriaNorth AmericaNorwayOECD membersOmanOther small statesPakistanPanamaPapua New GuineaParaguayPeruPhilippinesPolandPortugalPost-demographic dividendPre-demographic dividendPuerto RicoQatarRomaniaRussian FederationRwandaSaudi ArabiaSenegalSerbiaSeychellesSierra LeoneSingaporeSlovak RepublicSloveniaSmall statesSomaliaSouth AfricaSouth AsiaSouth Asia (IDA & IBRD)South SudanSpainSri LankaSub-Saharan Africa Sub-Saharan Africa (excluding high income)Sub-Saharan Africa (IDA & IBRD countries)SudanSurinameSwazilandSwedenSwitzerlandSyrian Arab RepublicTajikistanTanzaniaThailandTimor-LesteTogoTrinidad and TobagoTunisiaTurkeyTurkmenistanUgandaUkraineUnited Arab EmiratesUnited KingdomUnited StatesUpper middle incomeUruguayVanuatuVenezuela, RBVietnamWest Bank and GazaWorldZimbabwe línea de tiempo (timeline):
En esta escala de tiempo se presenta un gráfico de 1972 y 2016 de East Asia & Pacific. Los datos de 1971 están ausentes. El número de observaciones reales por fecha: 45.
Fuente (nombre):
Indicadores del desarrollo mundial
Fuente (organización):
World Bank national accounts data, and OECD National Accounts data files.
Categorías:
Economy & Growth
Se ha actualizado:
23 abr 2017 año
Los indicadores de los cambios de valor en los últimos años
Mínimo:
-0.46
1 ene 1999 año
Máximo:
8.249
1 ene 1974 año
A la fecha de observación
Valor
Cambio absoluto
El cambio con respecto al valor anterior
1 ene 1972 año
5.257
+5.257
0.0%
1 ene 1973 año
7.773
+2.516
47.86%
1 ene 1974 año
8.249
+0.477
6.13%
1 ene 1975 año
1.627
-6.622
-80.28%
1 ene 1976 año
4.497
+2.87
176.39%
1 ene 1977 año
3.047
-1.45
-32.25%
1 ene 1978 año
4.368
+1.321
43.36%
1 ene 1979 año
5.511
+1.143
26.18%
1 ene 1980 año
6.038
+0.527
9.56%
1 ene 1981 año
1.614
-4.424
-73.27%
1 ene 1982 año
3.425
+1.811
112.19%
1 ene 1983 año
4.556
+1.132
33.05%
1 ene 1984 año
3.871
-0.685
-15.04%
1 ene 1985 año
3.315
-0.556
-14.36%
1 ene 1986 año
3.841
+0.526
15.85%
1 ene 1987 año
4.049
+0.208
5.41%
1 ene 1988 año
4.535
+0.486
12.01%
1 ene 1989 año
5.063
+0.528
11.65%
1 ene 1990 año
5.598
+0.535
10.56%
1 ene 1991 año
6.089
+0.491
8.77%
1 ene 1992 año
3.761
-2.329
-38.24%
1 ene 1993 año
3.975
+0.214
5.69%
1 ene 1994 año
3.836
-0.139
-3.5%
1 ene 1995 año
4.258
+0.423
11.02%
1 ene 1996 año
4.548
+0.289
6.8%
1 ene 1997 año
4.763
+0.215
4.74%
1 ene 1998 año
2.687
-2.076
-43.6%
1 ene 1999 año
-0.46
-3.146
-117.12%
1 ene 2000 año
4.143
+4.603
-1.0 mil%
1 ene 2001 año
3.787
-0.356
-8.6%
1 ene 2002 año
3.325
-0.462
-12.19%
1 ene 2003 año
3.85
+0.525
15.79%
1 ene 2004 año
2.509
-1.341
-34.83%
1 ene 2005 año
3.641
+1.131
45.08%
1 ene 2006 año
4.375
+0.735
20.18%
1 ene 2007 año
3.636
-0.74
-16.91%
1 ene 2008 año
4.804
+1.169
32.15%
1 ene 2009 año
2.656
-2.149
-44.72%
1 ene 2010 año
2.672
+0.017
0.63%
1 ene 2011 año
5.064
+2.391
89.47%
1 ene 2012 año
4.68
-0.384
-7.58%
1 ene 2013 año
4.618
-0.062
-1.32%
1 ene 2014 año
3.829
-0.789
-17.09%
1 ene 2015 año
3.278
-0.551
-14.38%
1 ene 2016 año
3.341
+0.063
1.92%
Ranking de los países por los datos estadísticos actuales


Comentarios: