29
/es/
es
AIzaSyAYiBZKx7MnpbEhh9jyipgxe19OcubqV5w
April 1, 2024
187880
Malaysia
MYS
true
2
1
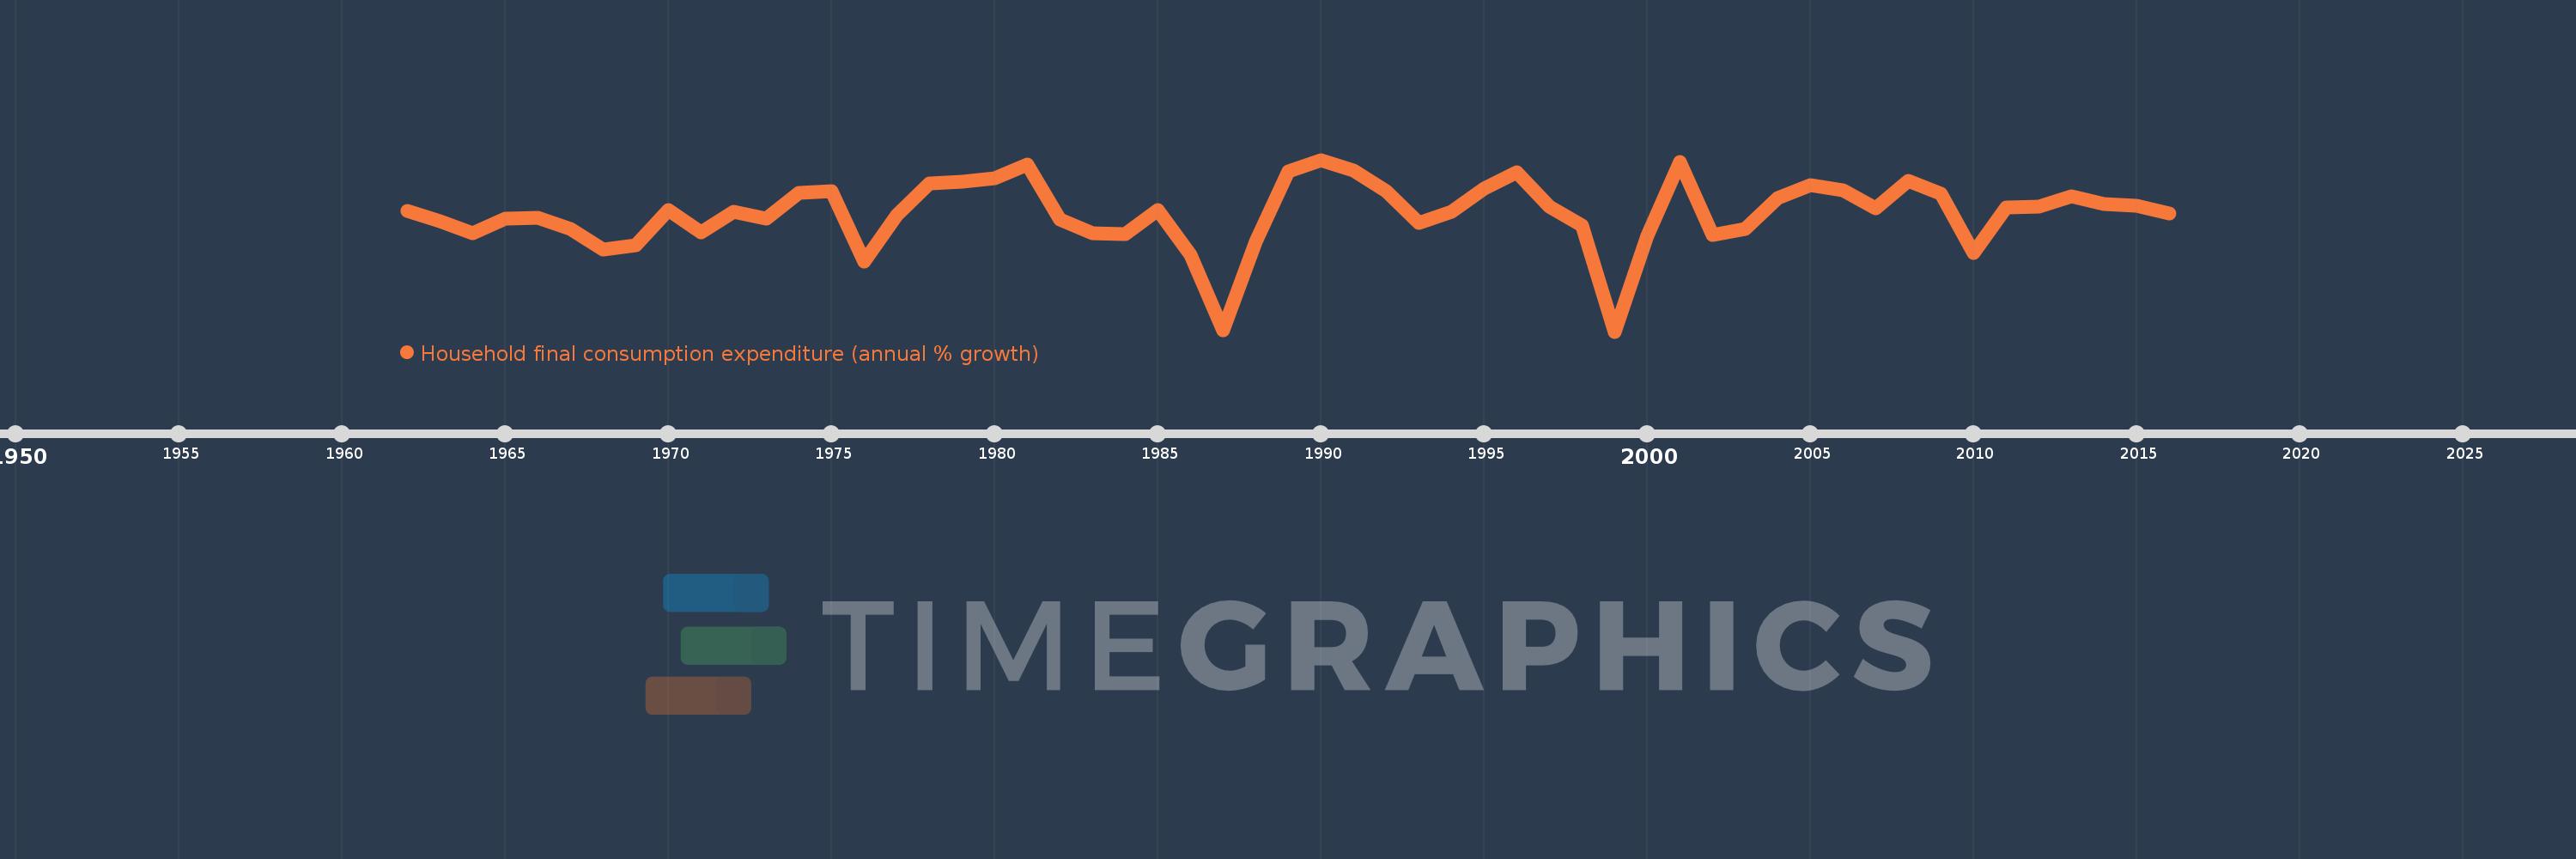
Household final consumption expenditure (annual % growth)
2016,2015,2014,2013,2012,2011,2010,2009,2008,2007,2006,2005,2004,2003,2002,2001,2000,1999,1998,1997,1996,1995,1994,1993,1992,1991,1990,1989,1988,1987,1986,1985,1984,1983,1982,1981,1980,1979,1978,1977,1976,1975,1974,1973,1972,1971,1970,1969,1968,1967,1966,1965,1964,1963,1962
Estas estadísticas en otros países:
AlbaniaAlgeriaAntigua and BarbudaArab WorldArgentinaArmeniaAustraliaAustriaAzerbaijanBahamas, TheBahrainBangladeshBarbadosBelarusBelgiumBelizeBeninBhutanBoliviaBosnia and HerzegovinaBotswanaBrazilBrunei DarussalamBulgariaBurkina FasoBurundiCabo VerdeCambodiaCameroonCanadaCaribbean small statesCentral Europe and the BalticsChadChileChinaColombiaComorosCongo, Dem. Rep.Congo, Rep.Costa RicaCote d'IvoireCroatiaCubaCyprusCzech RepublicDenmarkDominican RepublicEarly-demographic dividendEast Asia & PacificEast Asia & Pacific (excluding high income)East Asia & Pacific (IDA & IBRD countries)EcuadorEgypt, Arab Rep.El SalvadorEquatorial GuineaEritreaEstoniaEthiopiaEuro areaEurope & Central AsiaEurope & Central Asia (excluding high income)Europe & Central Asia (IDA & IBRD countries)European UnionFinlandFranceGabonGambia, TheGeorgiaGermanyGhanaGreeceGuatemalaGuineaGuinea-BissauHaitiHeavily indebted poor countries (HIPC)High incomeHondurasHong Kong SAR, ChinaHungaryIBRD onlyIcelandIDA & IBRD totalIDA blendIDA onlyIDA totalIndiaIndonesiaIran, Islamic Rep.IrelandIsraelItalyJamaicaJapanJordanKazakhstanKenyaKorea, Rep.KosovoKuwaitKyrgyz RepublicLao PDRLate-demographic dividendLatin America & Caribbean Latin America & Caribbean (excluding high income)Latin America & the Caribbean (IDA & IBRD countries)LatviaLeast developed countries: UN classificationLebanonLiberiaLithuaniaLow & middle incomeLow incomeLower middle incomeLuxembourgMacao SAR, ChinaMacedonia, FYRMadagascarMalawiMalaysiaMaliMaltaMauritaniaMauritiusMexicoMiddle East & North AfricaMiddle East & North Africa (excluding high income)Middle East & North Africa (IDA & IBRD countries)Middle incomeMoldovaMongoliaMontenegroMoroccoMozambiqueNamibiaNepalNetherlandsNew ZealandNicaraguaNigerNigeriaNorth AmericaNorwayOECD membersOmanOther small statesPakistanPanamaPapua New GuineaParaguayPeruPhilippinesPolandPortugalPost-demographic dividendPre-demographic dividendPuerto RicoQatarRomaniaRussian FederationRwandaSaudi ArabiaSenegalSerbiaSeychellesSierra LeoneSingaporeSlovak RepublicSloveniaSmall statesSomaliaSouth AfricaSouth AsiaSouth Asia (IDA & IBRD)South SudanSpainSri LankaSub-Saharan Africa Sub-Saharan Africa (excluding high income)Sub-Saharan Africa (IDA & IBRD countries)SudanSurinameSwazilandSwedenSwitzerlandSyrian Arab RepublicTajikistanTanzaniaThailandTimor-LesteTogoTrinidad and TobagoTunisiaTurkeyTurkmenistanUgandaUkraineUnited Arab EmiratesUnited KingdomUnited StatesUpper middle incomeUruguayVanuatuVenezuela, RBVietnamWest Bank and GazaWorldZimbabwe línea de tiempo (timeline):
En esta escala de tiempo se presenta un gráfico de 1962 y 2016 de Malaysia. Los datos de 1961 están ausentes. El número de observaciones reales por fecha: 55.
Fuente (nombre):
Indicadores del desarrollo mundial
Fuente (organización):
World Bank national accounts data, and OECD National Accounts data files.
Categorías:
Economy & Growth
Se ha actualizado:
23 abr 2017 año
Los indicadores de los cambios de valor en los últimos años
Mínimo:
-10.236
1 ene 1999 año
Máximo:
13.322
1 ene 1990 año
A la fecha de observación
Valor
Cambio absoluto
El cambio con respecto al valor anterior
1 ene 1962 año
6.336
+6.336
0.0%
1 ene 1963 año
4.877
-1.46
-23.04%
1 ene 1964 año
3.258
-1.618
-33.18%
1 ene 1965 año
5.278
+2.02
61.98%
1 ene 1966 año
5.365
+0.087
1.66%
1 ene 1967 año
3.806
-1.559
-29.05%
1 ene 1968 año
0.995
-2.812
-73.87%
1 ene 1969 año
1.555
+0.56
56.29%
1 ene 1970 año
6.456
+4.902
315.28%
1 ene 1971 año
3.385
-3.071
-47.57%
1 ene 1972 año
6.151
+2.766
81.71%
1 ene 1973 año
5.274
-0.877
-14.26%
1 ene 1974 año
8.759
+3.485
66.09%
1 ene 1975 año
8.999
+0.24
2.74%
1 ene 1976 año
-0.587
-9.586
-106.52%
1 ene 1977 año
5.707
+6.294
-1.07 mil%
1 ene 1978 año
10.14
+4.433
77.68%
1 ene 1979 año
10.345
+0.205
2.02%
1 ene 1980 año
10.795
+0.45
4.35%
1 ene 1981 año
12.66
+1.866
17.28%
1 ene 1982 año
5.077
-7.583
-59.9%
1 ene 1983 año
3.29
-1.787
-35.2%
1 ene 1984 año
3.185
-0.105
-3.18%
1 ene 1985 año
6.451
+3.266
102.54%
1 ene 1986 año
0.343
-6.108
-94.68%
1 ene 1987 año
-10.01
-10.353
-3.02 mil%
1 ene 1988 año
2.06
+12.069
-120.58%
1 ene 1989 año
11.76
+9.701
470.99%
1 ene 1990 año
13.322
+1.562
13.28%
1 ene 1991 año
11.887
-1.435
-10.77%
1 ene 1992 año
9.045
-2.842
-23.91%
1 ene 1993 año
4.654
-4.392
-48.55%
1 ene 1994 año
6.253
+1.599
34.37%
1 ene 1995 año
9.389
+3.136
50.15%
1 ene 1996 año
11.657
+2.268
24.16%
1 ene 1997 año
6.865
-4.792
-41.11%
1 ene 1998 año
4.31
-2.555
-37.22%
1 ene 1999 año
-10.236
-14.546
-337.49%
1 ene 2000 año
2.86
+13.096
-127.94%
1 ene 2001 año
13.028
+10.169
355.56%
1 ene 2002 año
3.027
-10.001
-76.76%
1 ene 2003 año
3.872
+0.845
27.9%
1 ene 2004 año
8.113
+4.241
109.54%
1 ene 2005 año
9.849
+1.736
21.39%
1 ene 2006 año
9.109
-0.74
-7.51%
1 ene 2007 año
6.61
-2.499
-27.43%
1 ene 2008 año
10.444
+3.834
57.99%
1 ene 2009 año
8.719
-1.724
-16.51%
1 ene 2010 año
0.554
-8.165
-93.65%
1 ene 2011 año
6.767
+6.213
1.12 mil%
1 ene 2012 año
6.88
+0.113
1.67%
1 ene 2013 año
8.339
+1.459
21.2%
1 ene 2014 año
7.253
-1.086
-13.02%
1 ene 2015 año
6.979
-0.273
-3.77%
1 ene 2016 año
6.005
-0.974
-13.96%
Ranking de los países por los datos estadísticos actuales


Comentarios: