29
/es/
es
AIzaSyAYiBZKx7MnpbEhh9jyipgxe19OcubqV5w
April 1, 2024
264692
Togo
TGO
true
2
1
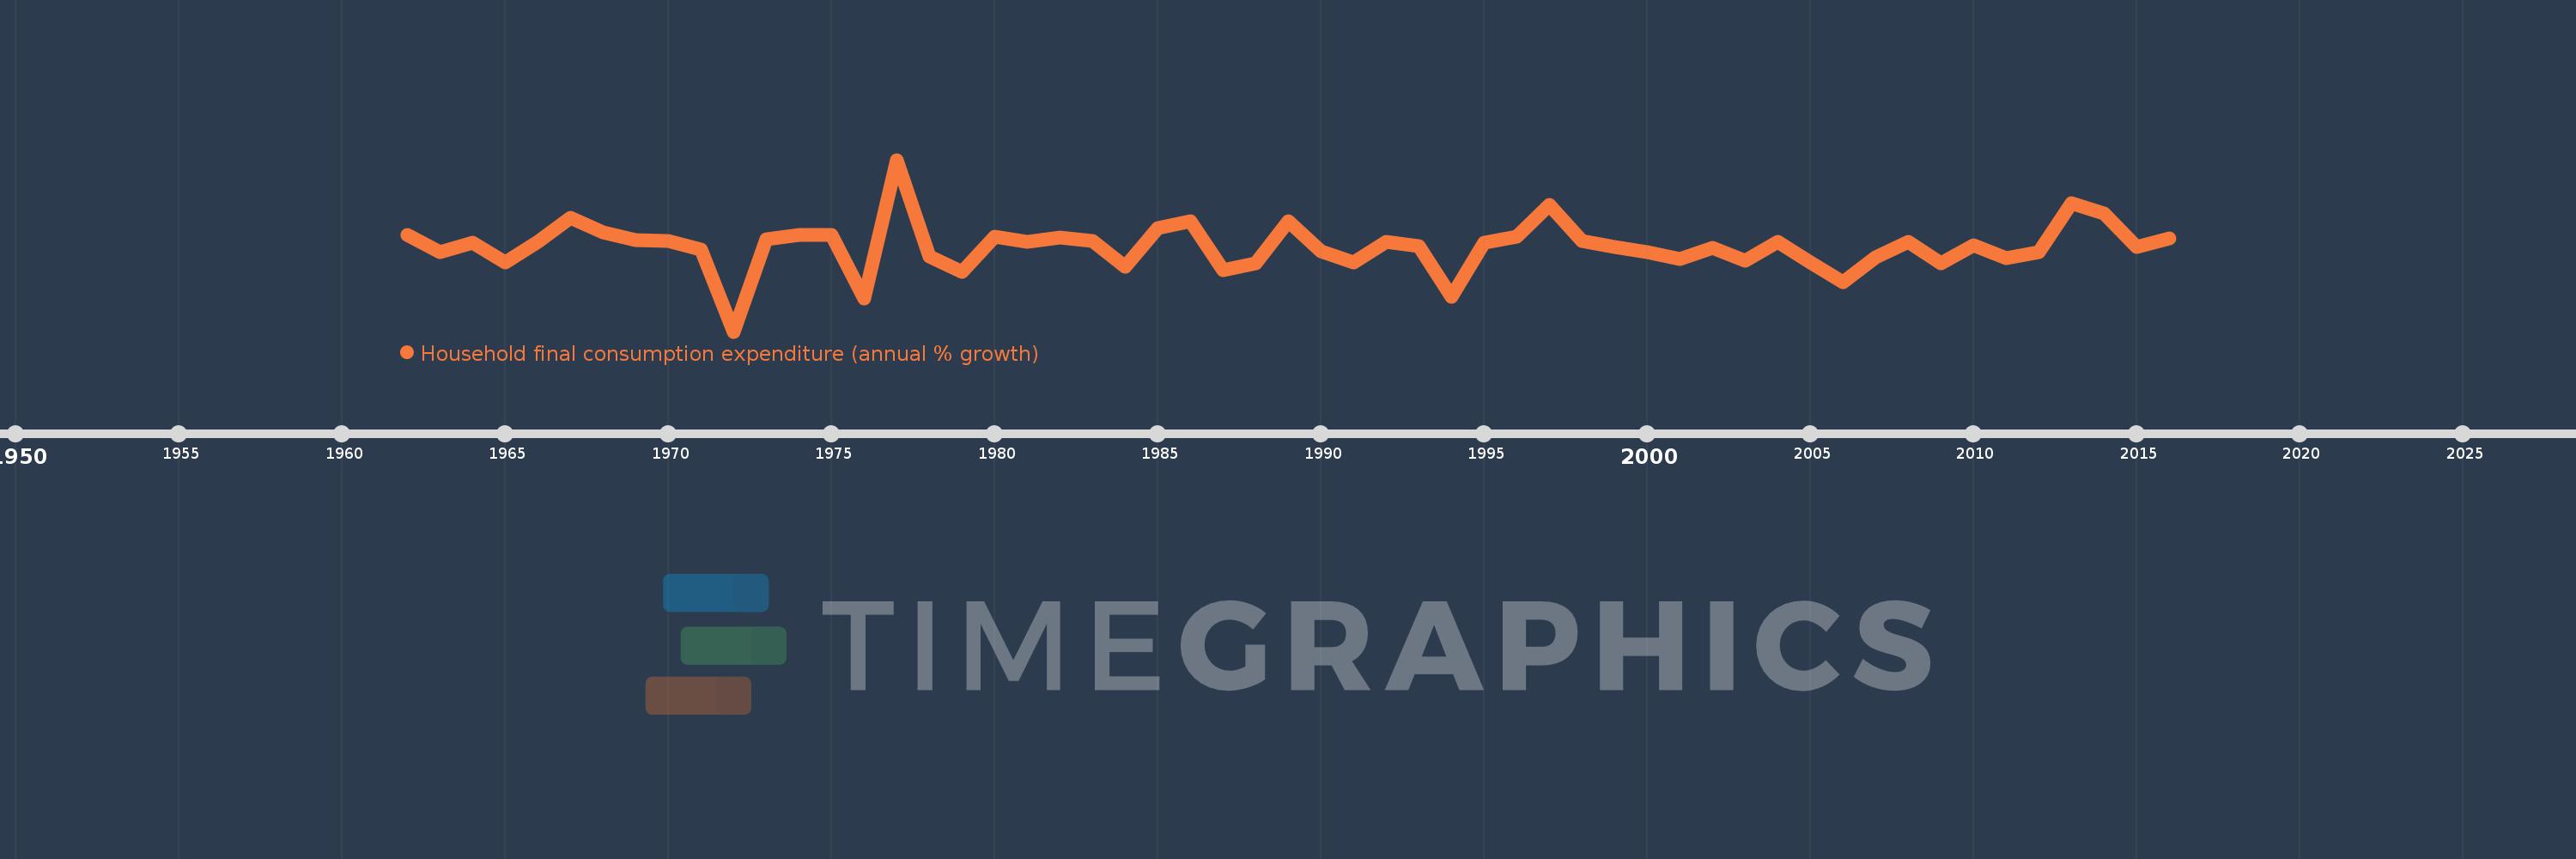
Household final consumption expenditure (annual % growth)
2016,2015,2014,2013,2012,2011,2010,2009,2008,2007,2006,2005,2004,2003,2002,2001,2000,1999,1998,1997,1996,1995,1994,1993,1992,1991,1990,1989,1988,1987,1986,1985,1984,1983,1982,1981,1980,1979,1978,1977,1976,1975,1974,1973,1972,1971,1970,1969,1968,1967,1966,1965,1964,1963,1962
Estas estadísticas en otros países:
AlbaniaAlgeriaAntigua and BarbudaArab WorldArgentinaArmeniaAustraliaAustriaAzerbaijanBahamas, TheBahrainBangladeshBarbadosBelarusBelgiumBelizeBeninBhutanBoliviaBosnia and HerzegovinaBotswanaBrazilBrunei DarussalamBulgariaBurkina FasoBurundiCabo VerdeCambodiaCameroonCanadaCaribbean small statesCentral Europe and the BalticsChadChileChinaColombiaComorosCongo, Dem. Rep.Congo, Rep.Costa RicaCote d'IvoireCroatiaCubaCyprusCzech RepublicDenmarkDominican RepublicEarly-demographic dividendEast Asia & PacificEast Asia & Pacific (excluding high income)East Asia & Pacific (IDA & IBRD countries)EcuadorEgypt, Arab Rep.El SalvadorEquatorial GuineaEritreaEstoniaEthiopiaEuro areaEurope & Central AsiaEurope & Central Asia (excluding high income)Europe & Central Asia (IDA & IBRD countries)European UnionFinlandFranceGabonGambia, TheGeorgiaGermanyGhanaGreeceGuatemalaGuineaGuinea-BissauHaitiHeavily indebted poor countries (HIPC)High incomeHondurasHong Kong SAR, ChinaHungaryIBRD onlyIcelandIDA & IBRD totalIDA blendIDA onlyIDA totalIndiaIndonesiaIran, Islamic Rep.IrelandIsraelItalyJamaicaJapanJordanKazakhstanKenyaKorea, Rep.KosovoKuwaitKyrgyz RepublicLao PDRLate-demographic dividendLatin America & Caribbean Latin America & Caribbean (excluding high income)Latin America & the Caribbean (IDA & IBRD countries)LatviaLeast developed countries: UN classificationLebanonLiberiaLithuaniaLow & middle incomeLow incomeLower middle incomeLuxembourgMacao SAR, ChinaMacedonia, FYRMadagascarMalawiMalaysiaMaliMaltaMauritaniaMauritiusMexicoMiddle East & North AfricaMiddle East & North Africa (excluding high income)Middle East & North Africa (IDA & IBRD countries)Middle incomeMoldovaMongoliaMontenegroMoroccoMozambiqueNamibiaNepalNetherlandsNew ZealandNicaraguaNigerNigeriaNorth AmericaNorwayOECD membersOmanOther small statesPakistanPanamaPapua New GuineaParaguayPeruPhilippinesPolandPortugalPost-demographic dividendPre-demographic dividendPuerto RicoQatarRomaniaRussian FederationRwandaSaudi ArabiaSenegalSerbiaSeychellesSierra LeoneSingaporeSlovak RepublicSloveniaSmall statesSomaliaSouth AfricaSouth AsiaSouth Asia (IDA & IBRD)South SudanSpainSri LankaSub-Saharan Africa Sub-Saharan Africa (excluding high income)Sub-Saharan Africa (IDA & IBRD countries)SudanSurinameSwazilandSwedenSwitzerlandSyrian Arab RepublicTajikistanTanzaniaThailandTimor-LesteTogoTrinidad and TobagoTunisiaTurkeyTurkmenistanUgandaUkraineUnited Arab EmiratesUnited KingdomUnited StatesUpper middle incomeUruguayVanuatuVenezuela, RBVietnamWest Bank and GazaWorldZimbabwe línea de tiempo (timeline):
En esta escala de tiempo se presenta un gráfico de 1962 y 2016 de Togo. Los datos de 1961 están ausentes. El número de observaciones reales por fecha: 55.
Fuente (nombre):
Indicadores del desarrollo mundial
Fuente (organización):
World Bank national accounts data, and OECD National Accounts data files.
Categorías:
Economy & Growth
Se ha actualizado:
23 abr 2017 año
Los indicadores de los cambios de valor en los últimos años
Mínimo:
-42.24
1 ene 1972 año
Máximo:
52.75
1 ene 1977 año
A la fecha de observación
Valor
Cambio absoluto
El cambio con respecto al valor anterior
1 ene 1962 año
11.217
+11.217
0.0%
1 ene 1963 año
1.611
-9.606
-85.64%
1 ene 1964 año
6.992
+5.381
334.1%
1 ene 1965 año
-4.013
-11.005
-157.39%
1 ene 1966 año
7.227
+11.24
-280.1%
1 ene 1967 año
20.466
+13.239
183.2%
1 ene 1968 año
12.848
-7.618
-37.22%
1 ene 1969 año
8.129
-4.719
-36.73%
1 ene 1970 año
8.067
-0.062
-0.76%
1 ene 1971 año
2.985
-5.081
-62.99%
1 ene 1972 año
-42.24
-45.225
-1.51 mil%
1 ene 1973 año
8.597
+50.837
-120.35%
1 ene 1974 año
11.308
+2.71
31.52%
1 ene 1975 año
11.043
-0.265
-2.34%
1 ene 1976 año
-24.001
-35.044
-317.34%
1 ene 1977 año
52.75
+76.751
-319.78%
1 ene 1978 año
-0.485
-53.235
-100.92%
1 ene 1979 año
-9.269
-8.785
1.81 mil%
1 ene 1980 año
10.078
+19.347
-208.73%
1 ene 1981 año
7.362
-2.716
-26.95%
1 ene 1982 año
9.89
+2.528
34.34%
1 ene 1983 año
7.7
-2.19
-22.14%
1 ene 1984 año
-6.407
-14.107
-183.2%
1 ene 1985 año
14.98
+21.387
-333.82%
1 ene 1986 año
18.794
+3.814
25.46%
1 ene 1987 año
-8.251
-27.044
-143.9%
1 ene 1988 año
-4.566
+3.685
-44.66%
1 ene 1989 año
18.975
+23.54
-515.59%
1 ene 1990 año
1.998
-16.977
-89.47%
1 ene 1991 año
-3.82
-5.818
-291.22%
1 ene 1992 año
7.244
+11.064
-289.65%
1 ene 1993 año
5.233
-2.011
-27.76%
1 ene 1994 año
-23.043
-28.276
-540.32%
1 ene 1995 año
6.724
+29.767
-129.18%
1 ene 1996 año
10.005
+3.28
48.78%
1 ene 1997 año
27.908
+17.903
178.95%
1 ene 1998 año
8.058
-19.85
-71.12%
1 ene 1999 año
4.387
-3.671
-45.56%
1 ene 2000 año
1.691
-2.696
-61.46%
1 ene 2001 año
-2.328
-4.019
-237.67%
1 ene 2002 año
4.145
+6.473
-278.06%
1 ene 2003 año
-3.036
-7.181
-173.24%
1 ene 2004 año
7.519
+10.555
-347.7%
1 ene 2005 año
-3.936
-11.455
-152.35%
1 ene 2006 año
-14.907
-10.971
278.72%
1 ene 2007 año
-1.033
+13.874
-93.07%
1 ene 2008 año
7.366
+8.398
-813.21%
1 ene 2009 año
-4.679
-12.045
-163.53%
1 ene 2010 año
5.652
+10.331
-220.79%
1 ene 2011 año
-1.697
-7.349
-130.03%
1 ene 2012 año
1.534
+3.231
-190.38%
1 ene 2013 año
28.772
+27.238
1.78 mil%
1 ene 2014 año
23.093
-5.679
-19.74%
1 ene 2015 año
4.32
-18.773
-81.29%
1 ene 2016 año
9.19
+4.87
112.72%
Ranking de los países por los datos estadísticos actuales


Comentarios: