29
/es/
es
AIzaSyAYiBZKx7MnpbEhh9jyipgxe19OcubqV5w
April 1, 2024
272764
Uganda
UGA
true
2
1
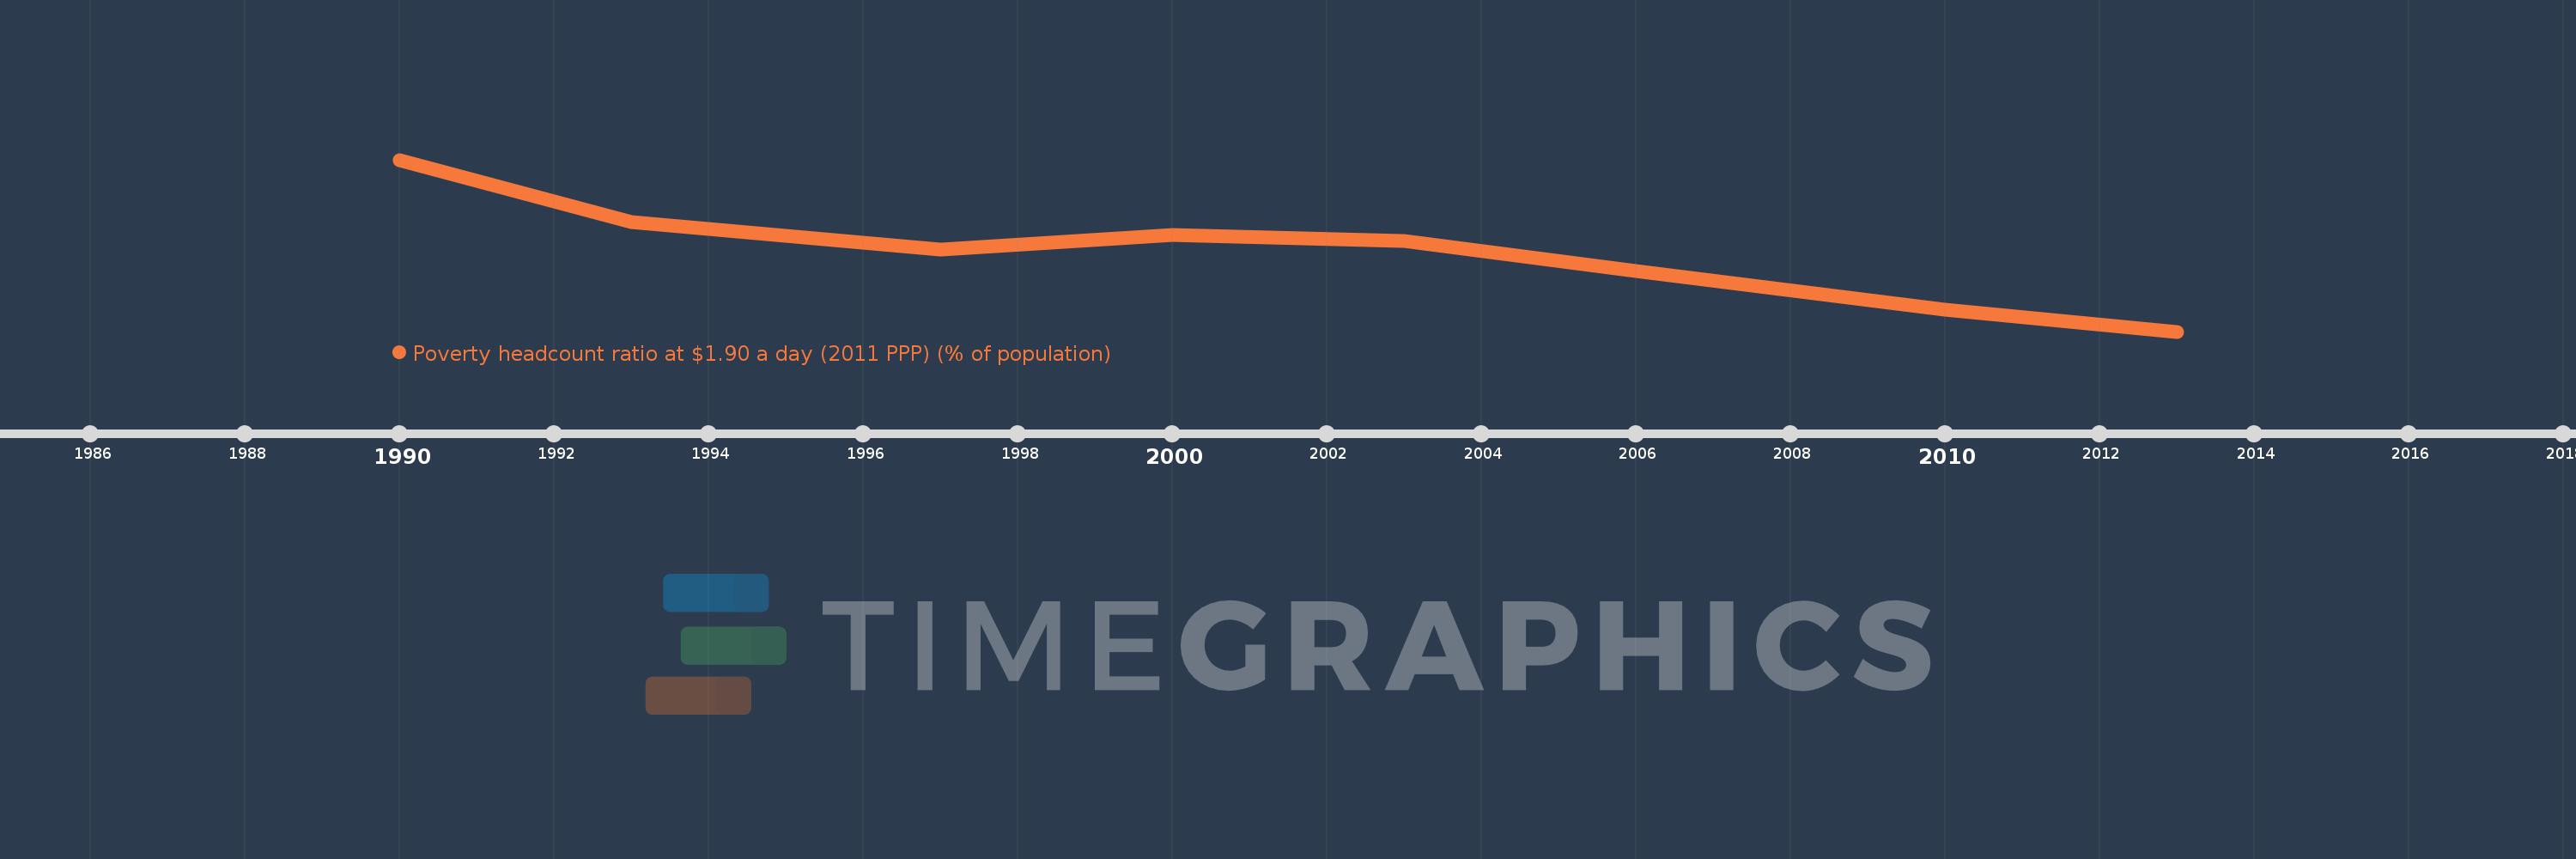
Poverty headcount ratio at $1.90 a day (2011 PPP) (% of population)
2013,2010,2006,2003,2000,1997,1993,1990
Estas estadísticas en otros países:
línea de tiempo (timeline):
En esta escala de tiempo se presenta un gráfico de 1990 y 2013 de Uganda. Los datos de 1989 están ausentes. El número de observaciones reales por fecha: 8.
Fuente (nombre):
Indicadores del desarrollo mundial
Fuente (organización):
World Bank, Development Research Group. Data are based on primary household survey data obtained from government statistical agencies and World Bank country departments. Data for high-income economies are from the Luxembourg Income Study database. For more information and methodology, please see PovcalNet (http://iresearch.worldbank.org/PovcalNet/index.htm).
Categorías:
Poverty, Aid Effectiveness, Climate Change
Se ha actualizado:
23 abr 2017 año
Los indicadores de los cambios de valor en los últimos años
Mínimo:
34.64
1 ene 2013 año
Máximo:
87.11
1 ene 1990 año
A la fecha de observación
Valor
Cambio absoluto
El cambio con respecto al valor anterior
1 ene 1990 año
87.11
+87.11
0.0%
1 ene 1993 año
68.11
-19.0
-21.81%
1 ene 1997 año
59.6
-8.51
-12.49%
1 ene 2000 año
64.12
+4.52
7.58%
1 ene 2003 año
62.21
-1.91
-2.98%
1 ene 2006 año
53.18
-9.03
-14.52%
1 ene 2010 año
41.46
-11.72
-22.04%
1 ene 2013 año
34.64
-6.82
-16.45%
Ranking de los países por los datos estadísticos actuales


Comentarios: