29
/es/
es
AIzaSyAYiBZKx7MnpbEhh9jyipgxe19OcubqV5w
April 1, 2024
200836
Montenegro
MNE
true
2
1
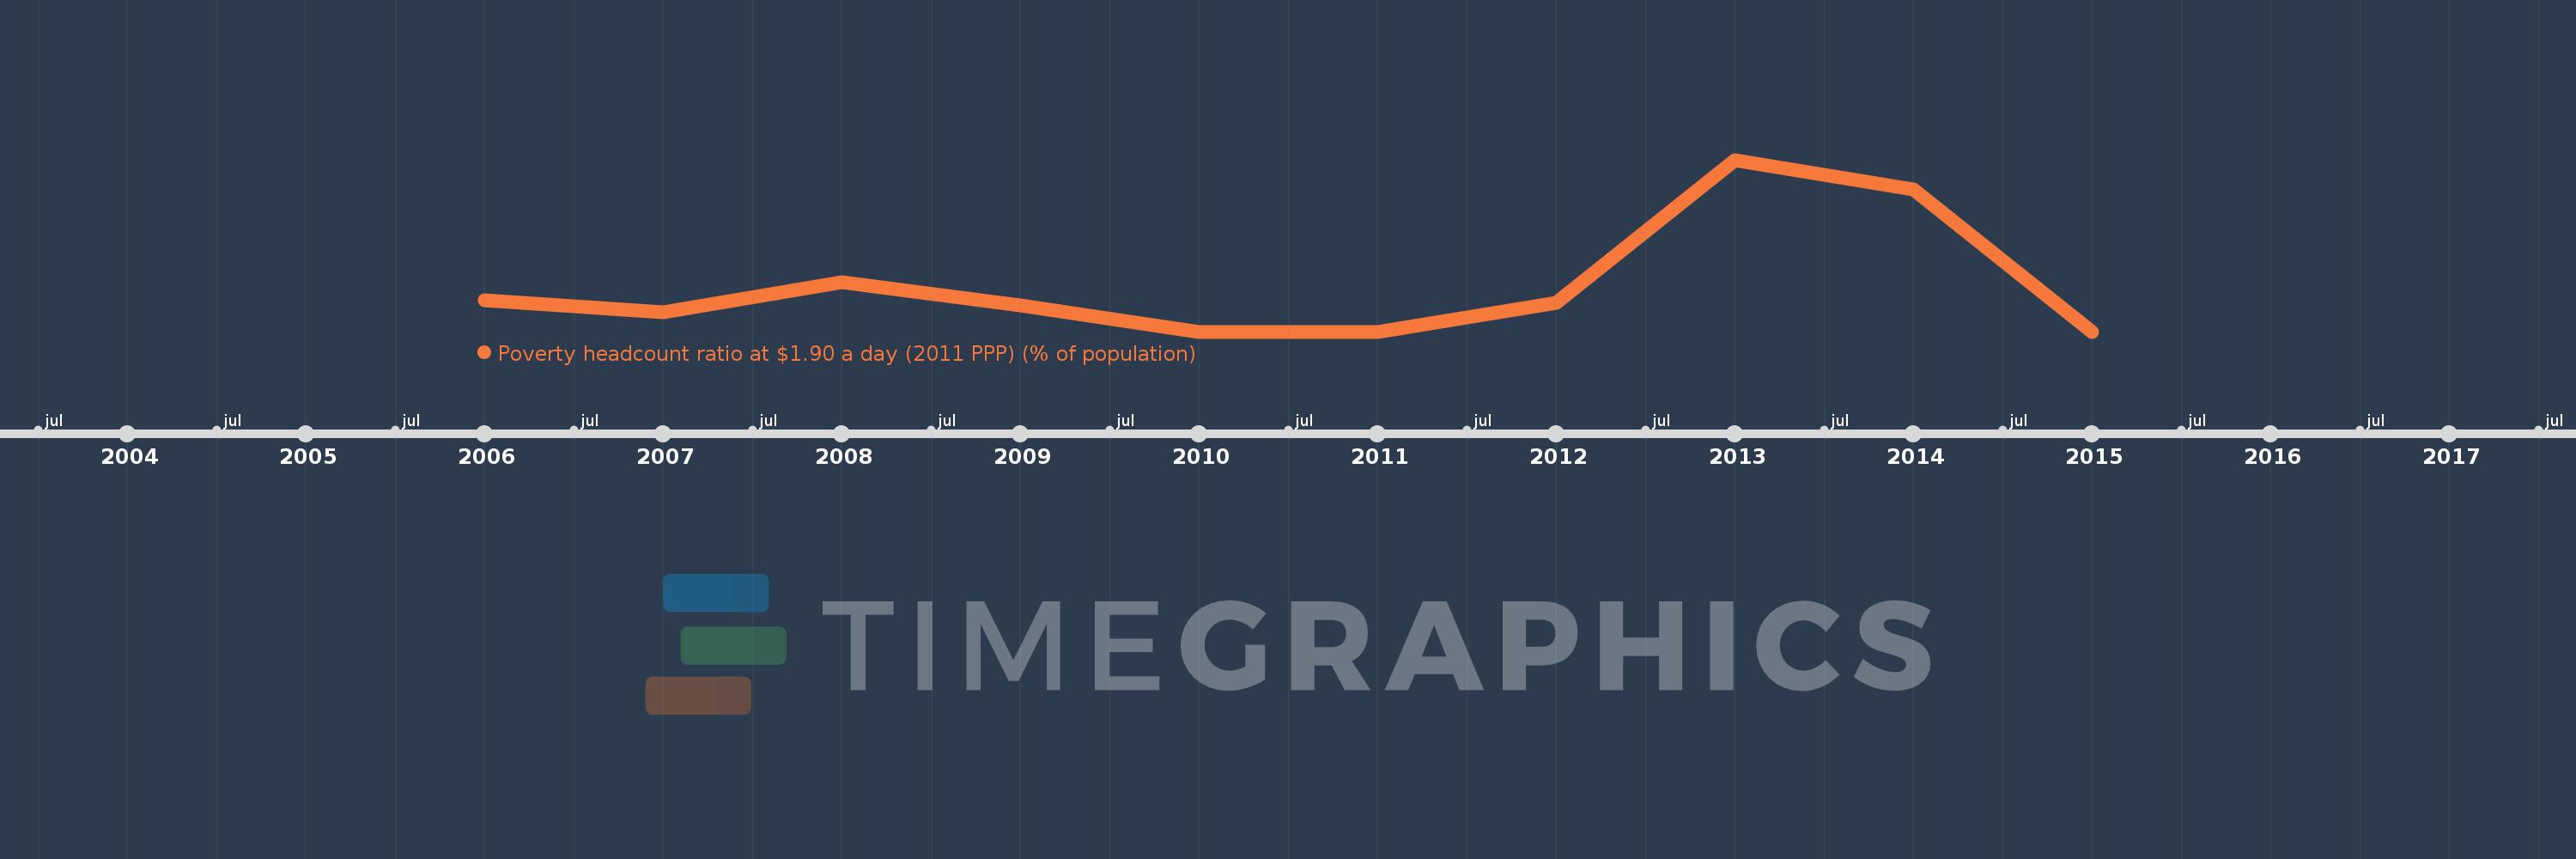
Poverty headcount ratio at $1.90 a day (2011 PPP) (% of population)
2015,2014,2013,2012,2011,2010,2009,2008,2007,2006
Estas estadísticas en otros países:
línea de tiempo (timeline):
En esta escala de tiempo se presenta un gráfico de 2006 y 2015 de Montenegro. Los datos de 2005 están ausentes. El número de observaciones reales por fecha: 10.
Fuente (nombre):
Indicadores del desarrollo mundial
Fuente (organización):
World Bank, Development Research Group. Data are based on primary household survey data obtained from government statistical agencies and World Bank country departments. Data for high-income economies are from the Luxembourg Income Study database. For more information and methodology, please see PovcalNet (http://iresearch.worldbank.org/PovcalNet/index.htm).
Categorías:
Poverty, Aid Effectiveness, Climate Change
Se ha actualizado:
23 abr 2017 año
Los indicadores de los cambios de valor en los últimos años
Máximo:
1.26
1 ene 2013 año
A la fecha de observación
Valor
Cambio absoluto
El cambio con respecto al valor anterior
1 ene 2006 año
0.23
+0.23
0.0%
1 ene 2007 año
0.14
-0.09
-39.13%
1 ene 2008 año
0.36
+0.22
157.14%
1 ene 2009 año
0.19
-0.17
-47.22%
1 ene 2010 año
0.0
-0.19
-100.0%
1 ene 2012 año
0.21
+0.21
%
1 ene 2013 año
1.26
+1.05
500.0%
1 ene 2014 año
1.04
-0.22
-17.46%
1 ene 2015 año
0.0
-1.04
-100.0%
Ranking de los países por los datos estadísticos actuales


Comentarios: