29
/es/
es
AIzaSyAYiBZKx7MnpbEhh9jyipgxe19OcubqV5w
April 1, 2024
156522
Indonesia
IDN
true
2
1
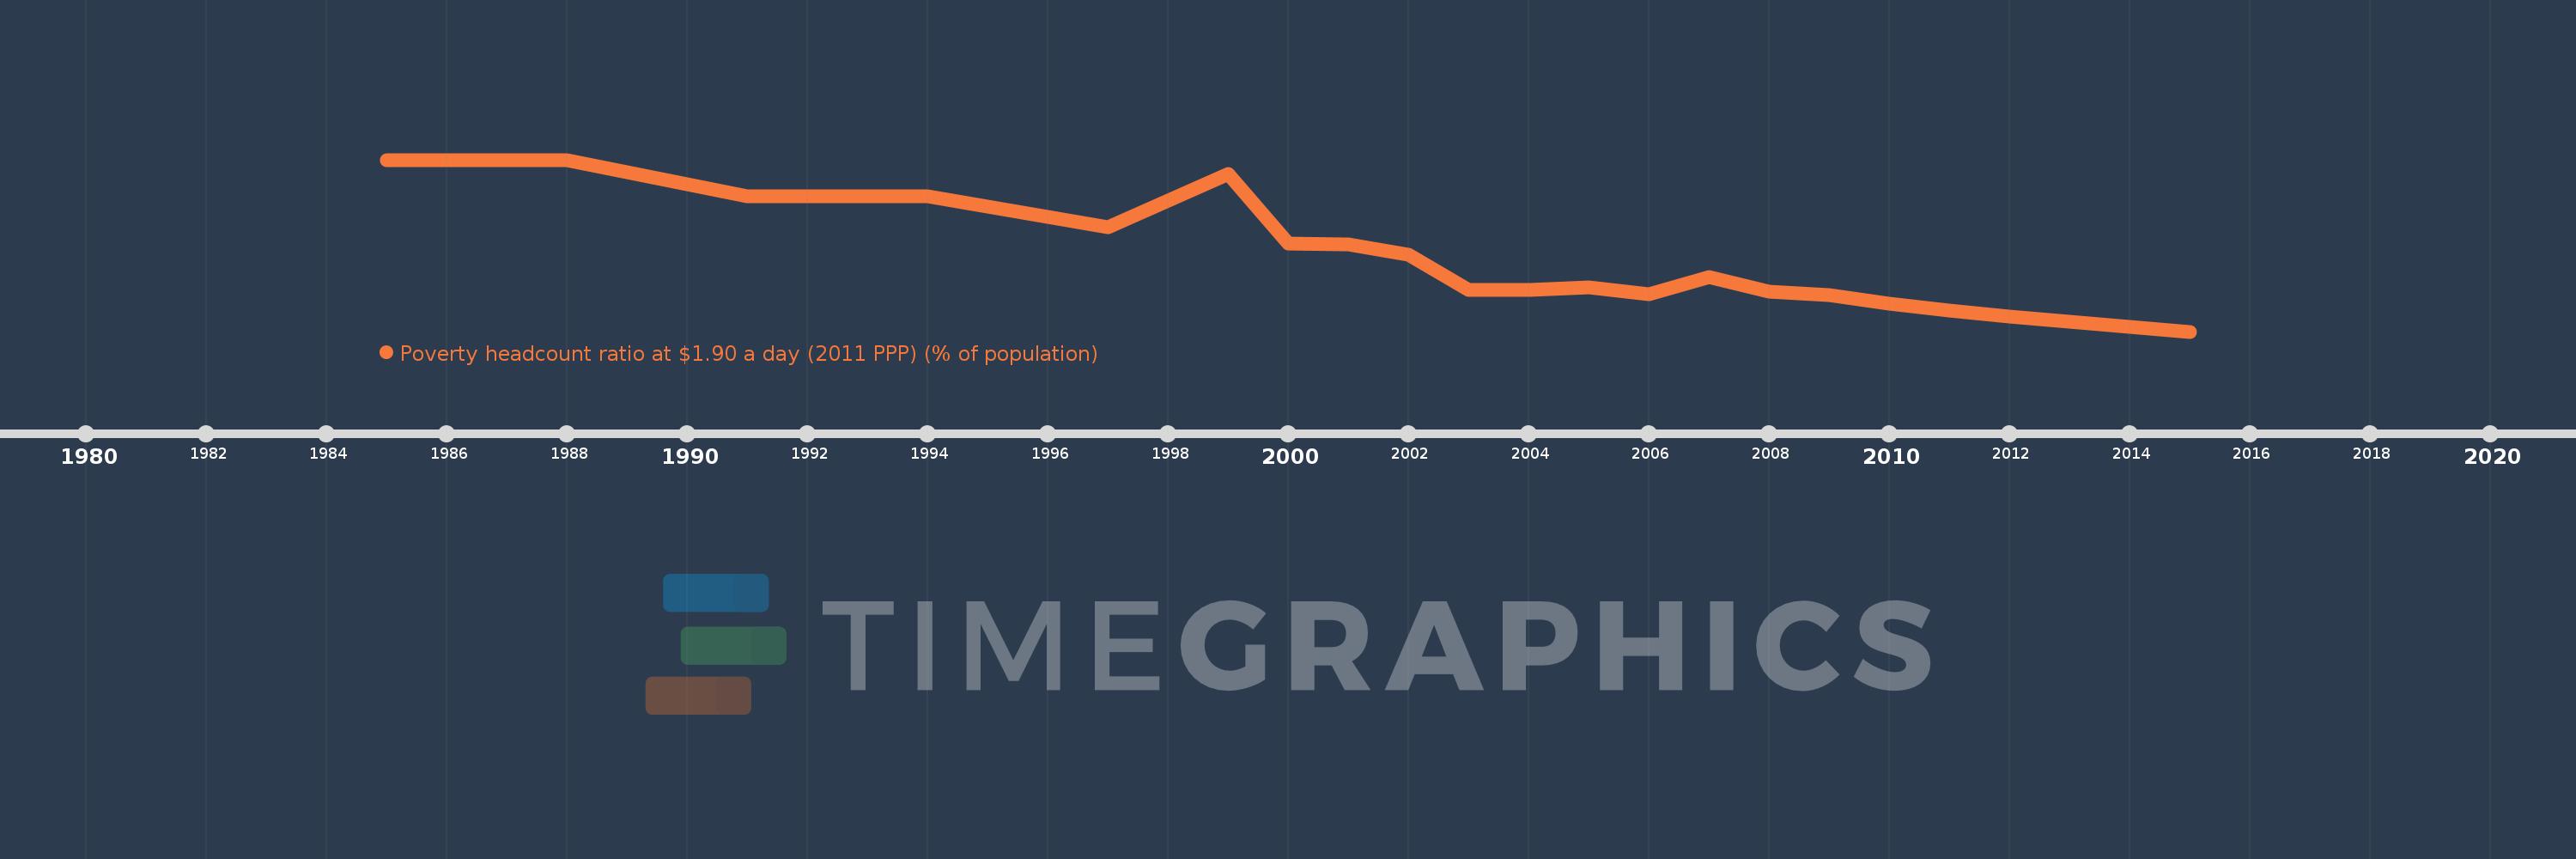
Poverty headcount ratio at $1.90 a day (2011 PPP) (% of population)
2015,2014,2013,2012,2011,2010,2009,2008,2007,2006,2005,2004,2003,2002,2001,2000,1999,1997,1994,1991,1988,1985
Estas estadísticas en otros países:
línea de tiempo (timeline):
En esta escala de tiempo se presenta un gráfico de 1985 y 2015 de Indonesia. Los datos de 1984 están ausentes. El número de observaciones reales por fecha: 22.
Fuente (nombre):
Indicadores del desarrollo mundial
Fuente (organización):
World Bank, Development Research Group. Data are based on primary household survey data obtained from government statistical agencies and World Bank country departments. Data for high-income economies are from the Luxembourg Income Study database. For more information and methodology, please see PovcalNet (http://iresearch.worldbank.org/PovcalNet/index.htm).
Categorías:
Poverty, Aid Effectiveness, Climate Change
Se ha actualizado:
23 abr 2017 año
Los indicadores de los cambios de valor en los últimos años
Mínimo:
8.25
1 ene 2015 año
Máximo:
70.31
1 ene 1985 año
A la fecha de observación
Valor
Cambio absoluto
El cambio con respecto al valor anterior
1 ene 1985 año
70.31
+70.31
0.0%
1 ene 1988 año
70.13
-0.18
-0.26%
1 ene 1991 año
57.27
-12.86
-18.34%
1 ene 1994 año
57.06
-0.21
-0.37%
1 ene 1997 año
45.89
-11.17
-19.58%
1 ene 1999 año
65.32
+19.43
42.34%
1 ene 2000 año
39.99
-25.33
-38.78%
1 ene 2001 año
39.75
-0.24
-0.6%
1 ene 2002 año
35.98
-3.77
-9.48%
1 ene 2003 año
23.4
-12.58
-34.96%
1 ene 2004 año
23.25
-0.15
-0.64%
1 ene 2005 año
24.37
+1.12
4.82%
1 ene 2006 año
21.63
-2.74
-11.24%
1 ene 2007 año
27.95
+6.32
29.22%
1 ene 2008 año
22.76
-5.19
-18.57%
1 ene 2009 año
21.55
-1.21
-5.32%
1 ene 2010 año
18.43
-3.12
-14.48%
1 ene 2011 año
15.95
-2.48
-13.46%
1 ene 2012 año
13.58
-2.37
-14.86%
1 ene 2013 año
11.76
-1.82
-13.4%
1 ene 2014 año
9.83
-1.93
-16.41%
1 ene 2015 año
8.25
-1.58
-16.07%
Ranking de los países por los datos estadísticos actuales


Comentarios: