29
/es/
es
AIzaSyAYiBZKx7MnpbEhh9jyipgxe19OcubqV5w
April 1, 2024
272550
Uganda
UGA
true
2
1
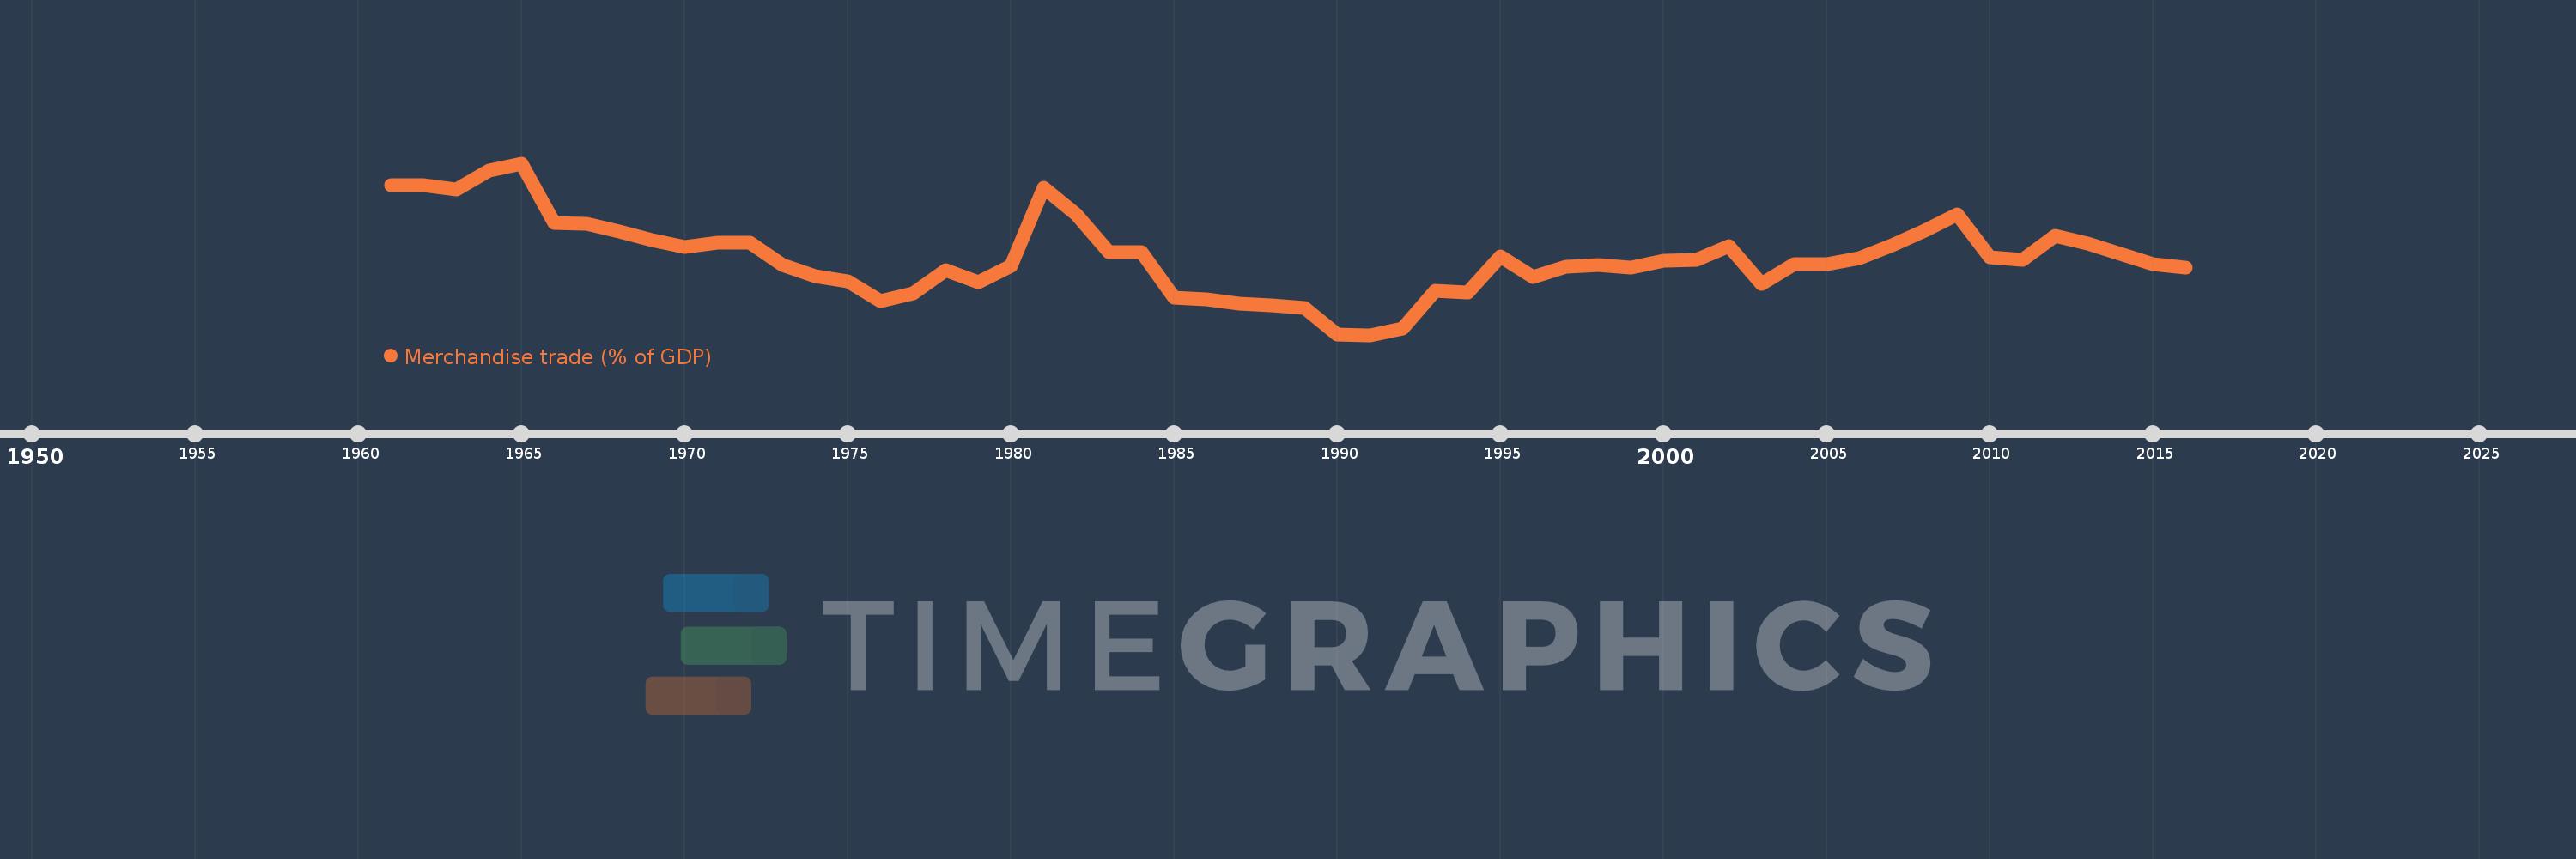
Merchandise trade (% of GDP)
2016,2015,2014,2013,2012,2011,2010,2009,2008,2007,2006,2005,2004,2003,2002,2001,2000,1999,1998,1997,1996,1995,1994,1993,1992,1991,1990,1989,1988,1987,1986,1985,1984,1983,1982,1981,1980,1979,1978,1977,1976,1975,1974,1973,1972,1971,1970,1969,1968,1967,1966,1965,1964,1963,1962,1961
Estas estadísticas en otros países:
AfghanistanAlbaniaAlgeriaAngolaAntigua and BarbudaArab WorldArgentinaArmeniaArubaAustraliaAustriaAzerbaijanBahamas, TheBahrainBangladeshBarbadosBelarusBelgiumBelizeBeninBermudaBhutanBoliviaBosnia and HerzegovinaBotswanaBrazilBrunei DarussalamBulgariaBurkina FasoBurundiCabo VerdeCambodiaCameroonCanadaCaribbean small statesCentral African RepublicCentral Europe and the BalticsChadChileChinaColombiaComorosCongo, Dem. Rep.Congo, Rep.Costa RicaCote d'IvoireCroatiaCubaCyprusCzech RepublicDenmarkDjiboutiDominicaDominican RepublicEarly-demographic dividendEast Asia & PacificEast Asia & Pacific (excluding high income)East Asia & Pacific (IDA & IBRD countries)EcuadorEgypt, Arab Rep.El SalvadorEquatorial GuineaEritreaEstoniaEthiopiaEuro areaEurope & Central AsiaEurope & Central Asia (excluding high income)Europe & Central Asia (IDA & IBRD countries)European UnionFaroe IslandsFijiFinlandFragile and conflict affected situationsFranceFrench PolynesiaGabonGambia, TheGeorgiaGermanyGhanaGreeceGreenlandGrenadaGuatemalaGuineaGuinea-BissauGuyanaHaitiHeavily indebted poor countries (HIPC)High incomeHondurasHong Kong SAR, ChinaHungaryIBRD onlyIcelandIDA & IBRD totalIDA blendIDA onlyIDA totalIndiaIndonesiaIran, Islamic Rep.IraqIrelandIsraelItalyJamaicaJapanJordanKazakhstanKenyaKiribatiKorea, Rep.KuwaitKyrgyz RepublicLao PDRLate-demographic dividendLatin America & Caribbean Latin America & Caribbean (excluding high income)Latin America & the Caribbean (IDA & IBRD countries)LatviaLeast developed countries: UN classificationLebanonLesothoLiberiaLibyaLithuaniaLow & middle incomeLow incomeLower middle incomeLuxembourgMacao SAR, ChinaMacedonia, FYRMadagascarMalawiMalaysiaMaldivesMaliMaltaMarshall IslandsMauritaniaMauritiusMexicoMicronesia, Fed. Sts.Middle East & North AfricaMiddle East & North Africa (excluding high income)Middle East & North Africa (IDA & IBRD countries)Middle incomeMoldovaMongoliaMontenegroMoroccoMozambiqueMyanmarNamibiaNepalNetherlandsNew CaledoniaNew ZealandNicaraguaNigerNigeriaNorth AmericaNorwayOECD membersOmanOther small statesPacific island small statesPakistanPalauPanamaPapua New GuineaParaguayPeruPhilippinesPolandPortugalPost-demographic dividendPre-demographic dividendQatarRomaniaRussian FederationRwandaSamoaSao Tome and PrincipeSaudi ArabiaSenegalSerbiaSeychellesSierra LeoneSingaporeSlovak RepublicSloveniaSmall statesSolomon IslandsSouth AfricaSouth AsiaSouth Asia (IDA & IBRD)SpainSri LankaSt. Kitts and NevisSt. LuciaSt. Vincent and the GrenadinesSub-Saharan Africa Sub-Saharan Africa (excluding high income)Sub-Saharan Africa (IDA & IBRD countries)SudanSurinameSwazilandSwedenSwitzerlandSyrian Arab RepublicTajikistanTanzaniaThailandTimor-LesteTogoTongaTrinidad and TobagoTunisiaTurkeyTurkmenistanTuvaluUgandaUkraineUnited Arab EmiratesUnited KingdomUnited StatesUpper middle incomeUruguayUzbekistanVanuatuVenezuela, RBVietnamWorldYemen, Rep.ZambiaZimbabwe línea de tiempo (timeline):
En esta escala de tiempo se presenta un gráfico de 1961 y 2016 de Uganda. Los datos de 1960 están ausentes. El número de observaciones reales por fecha: 56.
Fuente (nombre):
Indicadores del desarrollo mundial
Fuente (organización):
World Trade Organization, and World Bank GDP estimates.
Categorías:
Private Sector, Trade
Se ha actualizado:
23 abr 2017 año
Los indicadores de los cambios de valor en los últimos años
Mínimo:
10.222
1 ene 1991 año
Máximo:
58.215
1 ene 1965 año
A la fecha de observación
Valor
Cambio absoluto
El cambio con respecto al valor anterior
1 ene 1961 año
52.107
+52.107
0.0%
1 ene 1962 año
52.137
+0.03
0.06%
1 ene 1963 año
51.014
-1.123
-2.15%
1 ene 1964 año
56.259
+5.245
10.28%
1 ene 1965 año
58.215
+1.956
3.48%
1 ene 1966 año
41.49
-16.724
-28.73%
1 ene 1967 año
41.405
-0.085
-0.21%
1 ene 1968 año
39.097
-2.309
-5.58%
1 ene 1969 año
36.677
-2.42
-6.19%
1 ene 1970 año
34.864
-1.813
-4.94%
1 ene 1971 año
36.034
+1.17
3.36%
1 ene 1972 año
35.944
-0.089
-0.25%
1 ene 1973 año
29.832
-6.112
-17.0%
1 ene 1974 año
26.642
-3.19
-10.69%
1 ene 1975 año
25.155
-1.487
-5.58%
1 ene 1976 año
19.671
-5.484
-21.8%
1 ene 1977 año
21.91
+2.238
11.38%
1 ene 1978 año
28.247
+6.337
28.92%
1 ene 1979 año
24.863
-3.383
-11.98%
1 ene 1980 año
29.542
+4.678
18.82%
1 ene 1981 año
51.261
+21.719
73.52%
1 ene 1982 año
43.969
-7.292
-14.22%
1 ene 1983 año
33.341
-10.628
-24.17%
1 ene 1984 año
33.433
+0.092
0.27%
1 ene 1985 año
20.55
-12.883
-38.53%
1 ene 1986 año
20.286
-0.264
-1.28%
1 ene 1987 año
18.938
-1.348
-6.64%
1 ene 1988 año
18.614
-0.325
-1.71%
1 ene 1989 año
17.791
-0.823
-4.42%
1 ene 1990 año
10.329
-7.462
-41.94%
1 ene 1991 año
10.222
-0.107
-1.03%
1 ene 1992 año
11.922
+1.699
16.62%
1 ene 1993 año
22.643
+10.721
89.93%
1 ene 1994 año
22.171
-0.472
-2.08%
1 ene 1995 año
32.177
+10.006
45.13%
1 ene 1996 año
26.339
-5.838
-18.14%
1 ene 1997 año
29.415
+3.076
11.68%
1 ene 1998 año
29.844
+0.429
1.46%
1 ene 1999 año
29.112
-0.731
-2.45%
1 ene 2000 año
31.024
+1.912
6.57%
1 ene 2001 año
31.305
+0.281
0.91%
1 ene 2002 año
35.006
+3.701
11.82%
1 ene 2003 año
24.607
-10.399
-29.71%
1 ene 2004 año
30.088
+5.481
22.27%
1 ene 2005 año
29.968
-0.121
-0.4%
1 ene 2006 año
31.806
+1.838
6.13%
1 ene 2007 año
35.398
+3.592
11.29%
1 ene 2008 año
39.291
+3.893
11.0%
1 ene 2009 año
43.895
+4.603
11.72%
1 ene 2010 año
32.02
-11.875
-27.05%
1 ene 2011 año
31.124
-0.895
-2.8%
1 ene 2012 año
38.053
+6.929
22.26%
1 ene 2013 año
35.742
-2.311
-6.07%
1 ene 2014 año
32.911
-2.831
-7.92%
1 ene 2015 año
30.026
-2.885
-8.77%
1 ene 2016 año
29.15
-0.876
-2.92%
Ranking de los países por los datos estadísticos actuales


Comentarios: