29
/es/
es
AIzaSyAYiBZKx7MnpbEhh9jyipgxe19OcubqV5w
April 1, 2024
216731
Pakistan
PAK
true
2
1
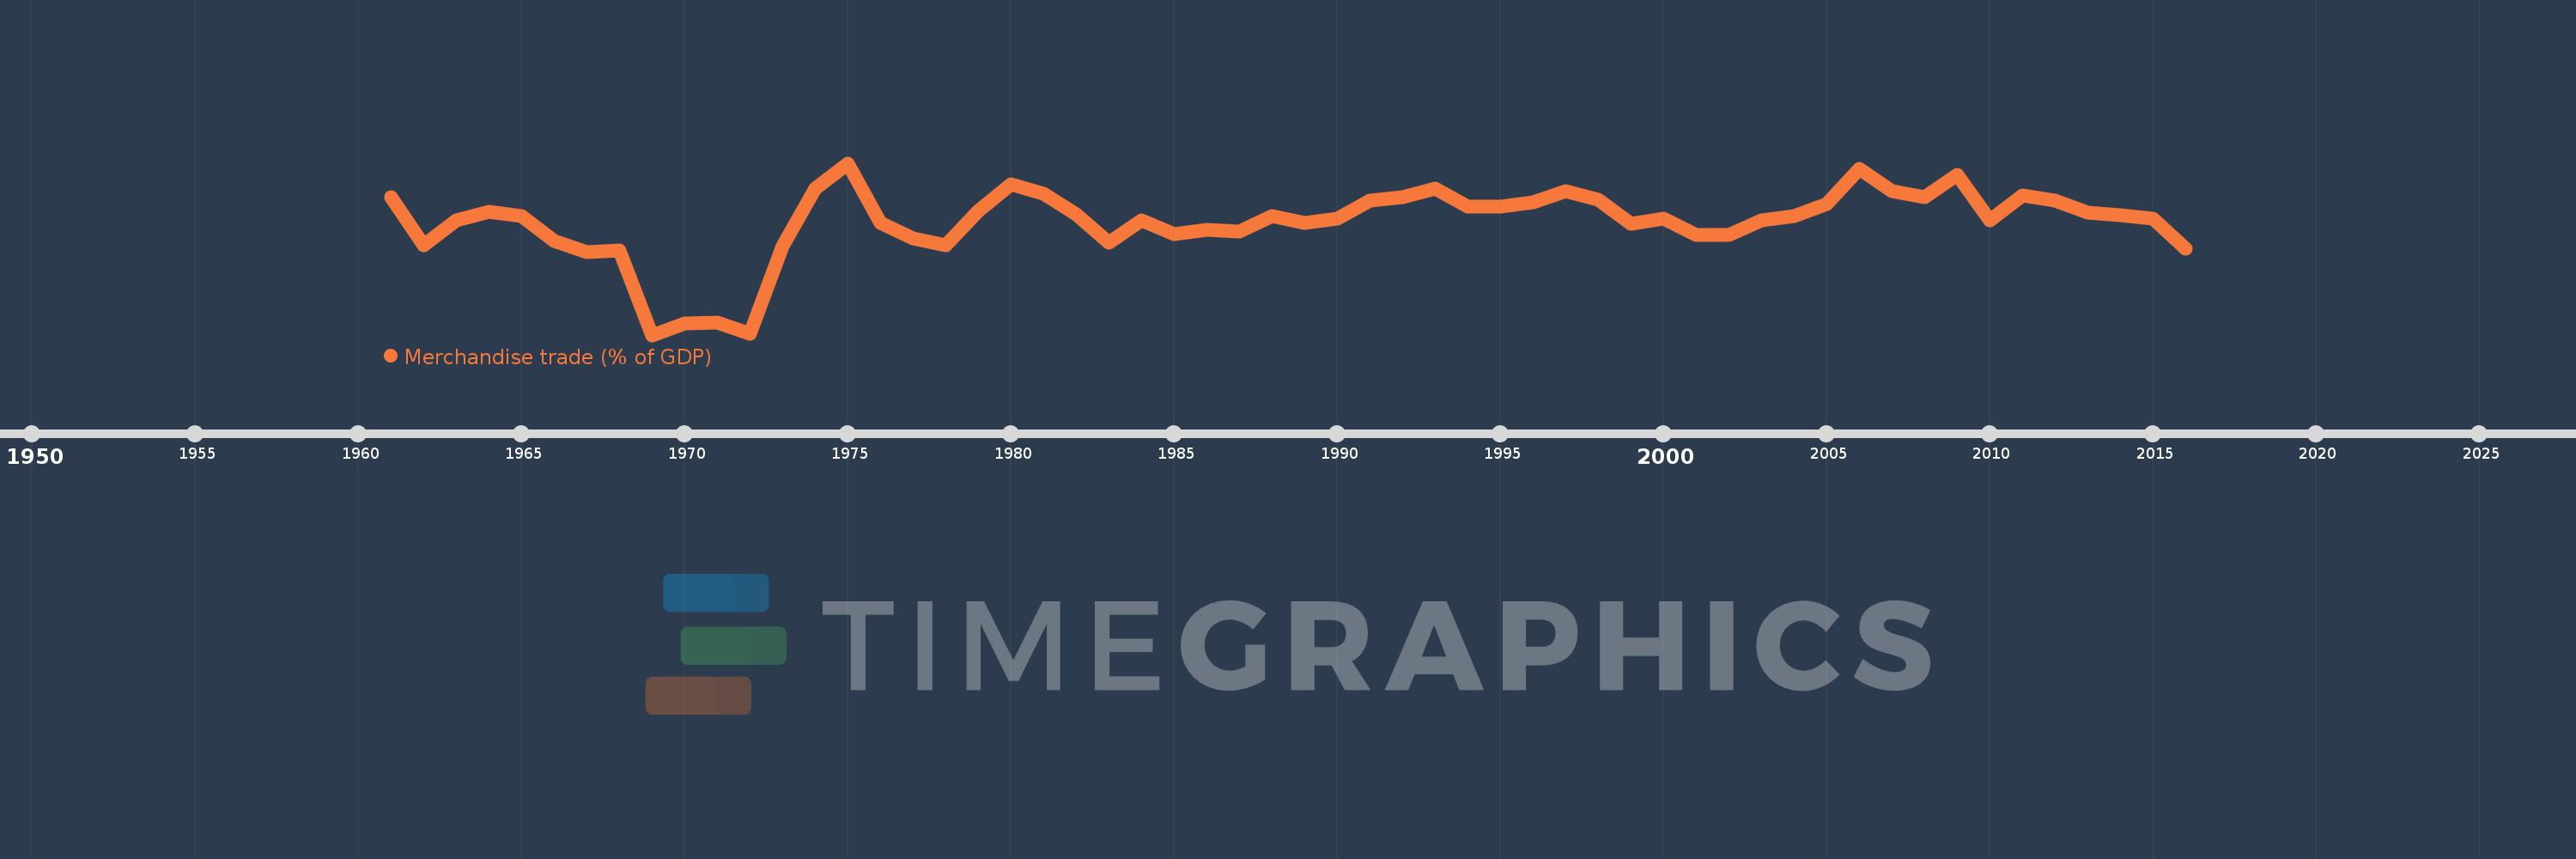
Merchandise trade (% of GDP)
2016,2015,2014,2013,2012,2011,2010,2009,2008,2007,2006,2005,2004,2003,2002,2001,2000,1999,1998,1997,1996,1995,1994,1993,1992,1991,1990,1989,1988,1987,1986,1985,1984,1983,1982,1981,1980,1979,1978,1977,1976,1975,1974,1973,1972,1971,1970,1969,1968,1967,1966,1965,1964,1963,1962,1961
Estas estadísticas en otros países:
AfghanistanAlbaniaAlgeriaAngolaAntigua and BarbudaArab WorldArgentinaArmeniaArubaAustraliaAustriaAzerbaijanBahamas, TheBahrainBangladeshBarbadosBelarusBelgiumBelizeBeninBermudaBhutanBoliviaBosnia and HerzegovinaBotswanaBrazilBrunei DarussalamBulgariaBurkina FasoBurundiCabo VerdeCambodiaCameroonCanadaCaribbean small statesCentral African RepublicCentral Europe and the BalticsChadChileChinaColombiaComorosCongo, Dem. Rep.Congo, Rep.Costa RicaCote d'IvoireCroatiaCubaCyprusCzech RepublicDenmarkDjiboutiDominicaDominican RepublicEarly-demographic dividendEast Asia & PacificEast Asia & Pacific (excluding high income)East Asia & Pacific (IDA & IBRD countries)EcuadorEgypt, Arab Rep.El SalvadorEquatorial GuineaEritreaEstoniaEthiopiaEuro areaEurope & Central AsiaEurope & Central Asia (excluding high income)Europe & Central Asia (IDA & IBRD countries)European UnionFaroe IslandsFijiFinlandFragile and conflict affected situationsFranceFrench PolynesiaGabonGambia, TheGeorgiaGermanyGhanaGreeceGreenlandGrenadaGuatemalaGuineaGuinea-BissauGuyanaHaitiHeavily indebted poor countries (HIPC)High incomeHondurasHong Kong SAR, ChinaHungaryIBRD onlyIcelandIDA & IBRD totalIDA blendIDA onlyIDA totalIndiaIndonesiaIran, Islamic Rep.IraqIrelandIsraelItalyJamaicaJapanJordanKazakhstanKenyaKiribatiKorea, Rep.KuwaitKyrgyz RepublicLao PDRLate-demographic dividendLatin America & Caribbean Latin America & Caribbean (excluding high income)Latin America & the Caribbean (IDA & IBRD countries)LatviaLeast developed countries: UN classificationLebanonLesothoLiberiaLibyaLithuaniaLow & middle incomeLow incomeLower middle incomeLuxembourgMacao SAR, ChinaMacedonia, FYRMadagascarMalawiMalaysiaMaldivesMaliMaltaMarshall IslandsMauritaniaMauritiusMexicoMicronesia, Fed. Sts.Middle East & North AfricaMiddle East & North Africa (excluding high income)Middle East & North Africa (IDA & IBRD countries)Middle incomeMoldovaMongoliaMontenegroMoroccoMozambiqueMyanmarNamibiaNepalNetherlandsNew CaledoniaNew ZealandNicaraguaNigerNigeriaNorth AmericaNorwayOECD membersOmanOther small statesPacific island small statesPakistanPalauPanamaPapua New GuineaParaguayPeruPhilippinesPolandPortugalPost-demographic dividendPre-demographic dividendQatarRomaniaRussian FederationRwandaSamoaSao Tome and PrincipeSaudi ArabiaSenegalSerbiaSeychellesSierra LeoneSingaporeSlovak RepublicSloveniaSmall statesSolomon IslandsSouth AfricaSouth AsiaSouth Asia (IDA & IBRD)SpainSri LankaSt. Kitts and NevisSt. LuciaSt. Vincent and the GrenadinesSub-Saharan Africa Sub-Saharan Africa (excluding high income)Sub-Saharan Africa (IDA & IBRD countries)SudanSurinameSwazilandSwedenSwitzerlandSyrian Arab RepublicTajikistanTanzaniaThailandTimor-LesteTogoTongaTrinidad and TobagoTunisiaTurkeyTurkmenistanTuvaluUgandaUkraineUnited Arab EmiratesUnited KingdomUnited StatesUpper middle incomeUruguayUzbekistanVanuatuVenezuela, RBVietnamWorldYemen, Rep.ZambiaZimbabwe línea de tiempo (timeline):
En esta escala de tiempo se presenta un gráfico de 1961 y 2016 de Pakistan. Los datos de 1960 están ausentes. El número de observaciones reales por fecha: 56.
Fuente (nombre):
Indicadores del desarrollo mundial
Fuente (organización):
World Trade Organization, and World Bank GDP estimates.
Categorías:
Private Sector, Trade
Se ha actualizado:
23 abr 2017 año
Los indicadores de los cambios de valor en los últimos años
Mínimo:
10.204
1 ene 1969 año
Máximo:
38.744
1 ene 1975 año
A la fecha de observación
Valor
Cambio absoluto
El cambio con respecto al valor anterior
1 ene 1961 año
33.101
+33.101
0.0%
1 ene 1962 año
25.119
-7.982
-24.11%
1 ene 1963 año
29.314
+4.195
16.7%
1 ene 1964 año
30.649
+1.335
4.55%
1 ene 1965 año
29.995
-0.654
-2.13%
1 ene 1966 año
25.808
-4.188
-13.96%
1 ene 1967 año
23.976
-1.832
-7.1%
1 ene 1968 año
24.2
+0.224
0.94%
1 ene 1969 año
10.204
-13.996
-57.83%
1 ene 1970 año
12.103
+1.899
18.61%
1 ene 1971 año
12.205
+0.102
0.84%
1 ene 1972 año
10.369
-1.836
-15.04%
1 ene 1973 año
25.004
+14.635
141.13%
1 ene 1974 año
34.574
+9.57
38.27%
1 ene 1975 año
38.744
+4.17
12.06%
1 ene 1976 año
28.796
-9.948
-25.68%
1 ene 1977 año
26.218
-2.578
-8.95%
1 ene 1978 año
25.115
-1.103
-4.21%
1 ene 1979 año
30.827
+5.711
22.74%
1 ene 1980 año
35.314
+4.488
14.56%
1 ene 1981 año
33.635
-1.679
-4.76%
1 ene 1982 año
30.298
-3.337
-9.92%
1 ene 1983 año
25.587
-4.711
-15.55%
1 ene 1984 año
29.297
+3.71
14.5%
1 ene 1985 año
27.0
-2.297
-7.84%
1 ene 1986 año
27.709
+0.709
2.63%
1 ene 1987 año
27.455
-0.254
-0.92%
1 ene 1988 año
29.966
+2.51
9.14%
1 ene 1989 año
28.883
-1.083
-3.61%
1 ene 1990 año
29.504
+0.621
2.15%
1 ene 1991 año
32.557
+3.053
10.35%
1 ene 1992 año
33.085
+0.529
1.62%
1 ene 1993 año
34.489
+1.404
4.24%
1 ene 1994 año
31.596
-2.894
-8.39%
1 ene 1995 año
31.469
-0.126
-0.4%
1 ene 1996 año
32.232
+0.762
2.42%
1 ene 1997 año
34.04
+1.808
5.61%
1 ene 1998 año
32.688
-1.352
-3.97%
1 ene 1999 año
28.692
-3.996
-12.22%
1 ene 2000 año
29.585
+0.893
3.11%
1 ene 2001 año
26.898
-2.687
-9.08%
1 ene 2002 año
26.869
-0.029
-0.11%
1 ene 2003 año
29.245
+2.376
8.84%
1 ene 2004 año
29.993
+0.749
2.56%
1 ene 2005 año
31.975
+1.981
6.61%
1 ene 2006 año
37.815
+5.84
18.27%
1 ene 2007 año
34.062
-3.753
-9.92%
1 ene 2008 año
33.092
-0.97
-2.85%
1 ene 2009 año
36.837
+3.745
11.32%
1 ene 2010 año
29.254
-7.583
-20.59%
1 ene 2011 año
33.379
+4.125
14.1%
1 ene 2012 año
32.49
-0.889
-2.66%
1 ene 2013 año
30.605
-1.885
-5.8%
1 ene 2014 año
30.174
-0.431
-1.41%
1 ene 2015 año
29.522
-0.652
-2.16%
1 ene 2016 año
24.5
-5.022
-17.01%
Ranking de los países por los datos estadísticos actuales


Comentarios: