29
/es/
es
AIzaSyAYiBZKx7MnpbEhh9jyipgxe19OcubqV5w
April 1, 2024
113879
Cote d'Ivoire
CIV
true
2
1
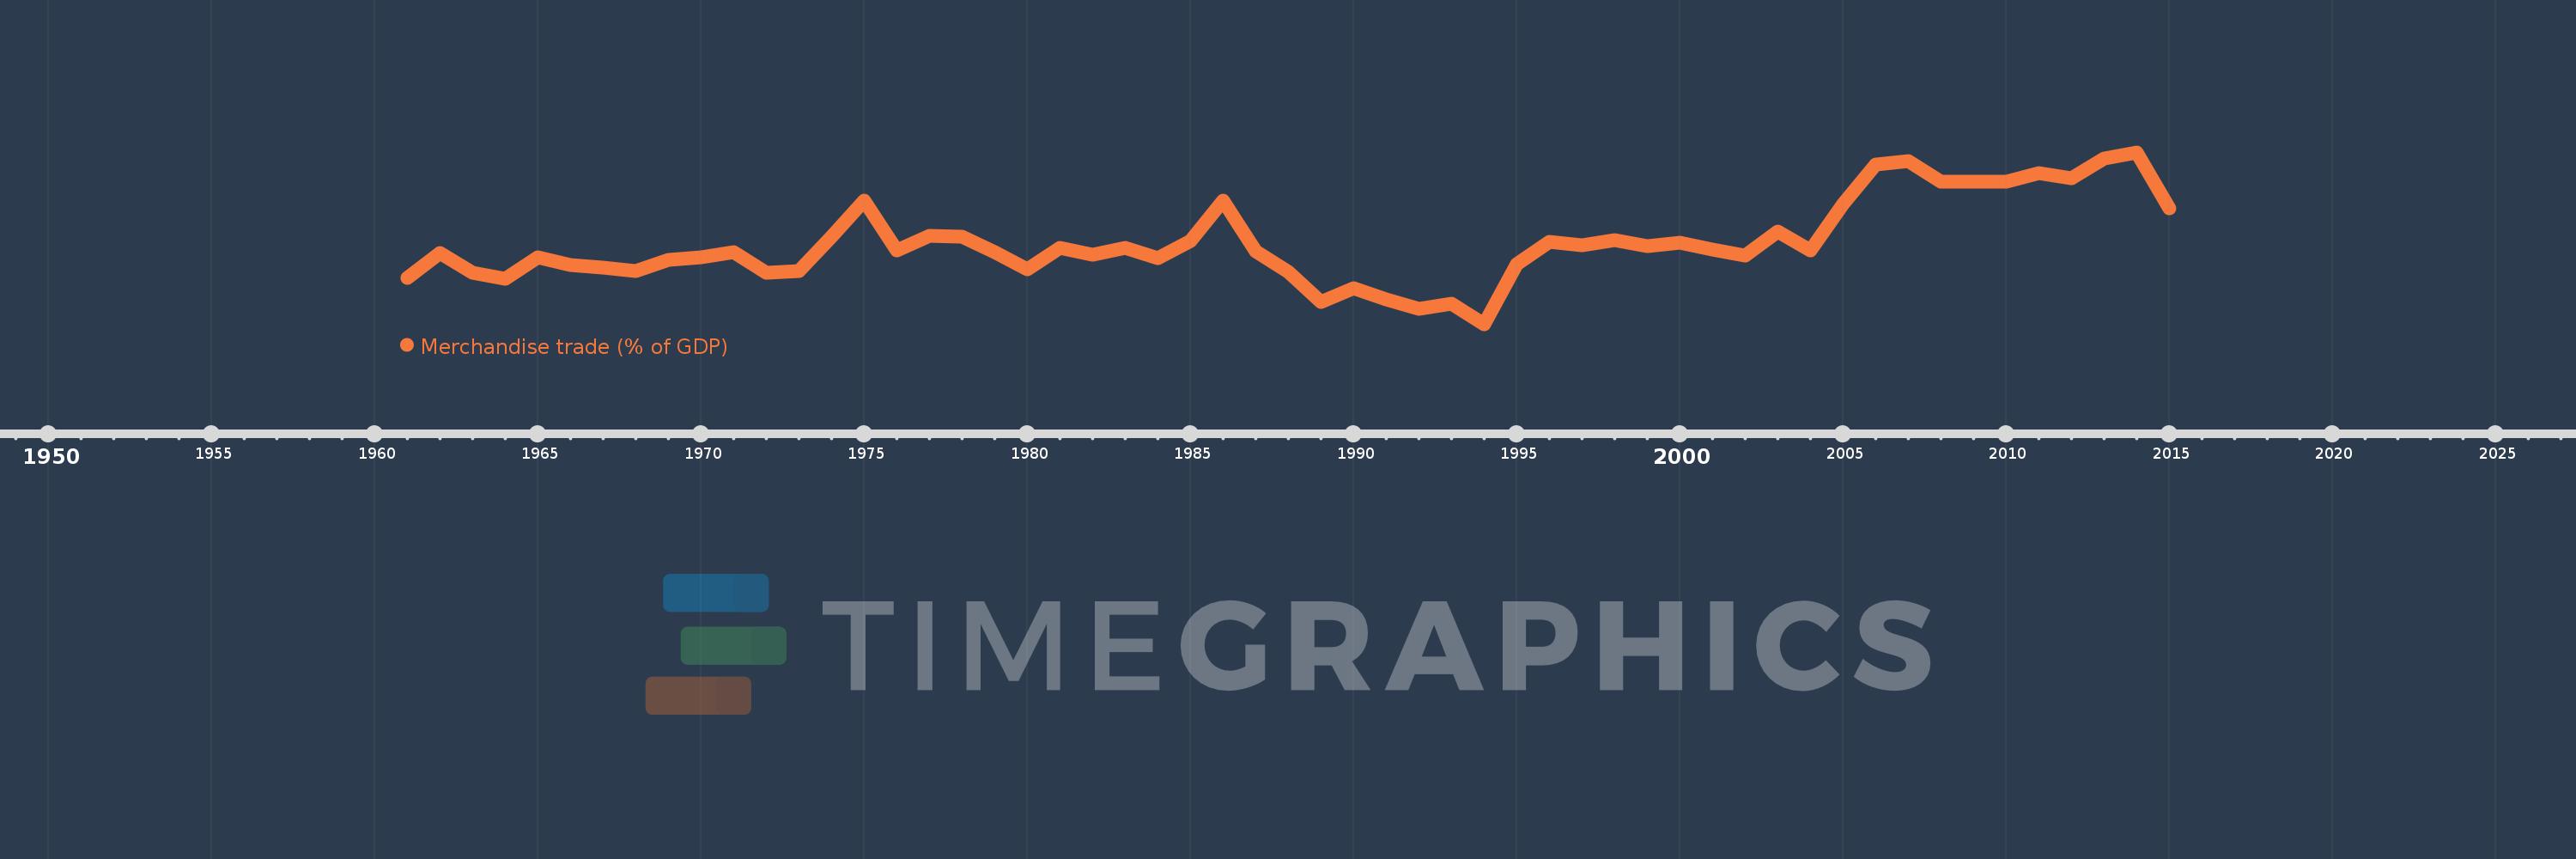
Merchandise trade (% of GDP)
2015,2014,2013,2012,2011,2010,2009,2008,2007,2006,2005,2004,2003,2002,2001,2000,1999,1998,1997,1996,1995,1994,1993,1992,1991,1990,1989,1988,1987,1986,1985,1984,1983,1982,1981,1980,1979,1978,1977,1976,1975,1974,1973,1972,1971,1970,1969,1968,1967,1966,1965,1964,1963,1962,1961
Estas estadísticas en otros países:
AfghanistanAlbaniaAlgeriaAngolaAntigua and BarbudaArab WorldArgentinaArmeniaArubaAustraliaAustriaAzerbaijanBahamas, TheBahrainBangladeshBarbadosBelarusBelgiumBelizeBeninBermudaBhutanBoliviaBosnia and HerzegovinaBotswanaBrazilBrunei DarussalamBulgariaBurkina FasoBurundiCabo VerdeCambodiaCameroonCanadaCaribbean small statesCentral African RepublicCentral Europe and the BalticsChadChileChinaColombiaComorosCongo, Dem. Rep.Congo, Rep.Costa RicaCote d'IvoireCroatiaCubaCyprusCzech RepublicDenmarkDjiboutiDominicaDominican RepublicEarly-demographic dividendEast Asia & PacificEast Asia & Pacific (excluding high income)East Asia & Pacific (IDA & IBRD countries)EcuadorEgypt, Arab Rep.El SalvadorEquatorial GuineaEritreaEstoniaEthiopiaEuro areaEurope & Central AsiaEurope & Central Asia (excluding high income)Europe & Central Asia (IDA & IBRD countries)European UnionFaroe IslandsFijiFinlandFragile and conflict affected situationsFranceFrench PolynesiaGabonGambia, TheGeorgiaGermanyGhanaGreeceGreenlandGrenadaGuatemalaGuineaGuinea-BissauGuyanaHaitiHeavily indebted poor countries (HIPC)High incomeHondurasHong Kong SAR, ChinaHungaryIBRD onlyIcelandIDA & IBRD totalIDA blendIDA onlyIDA totalIndiaIndonesiaIran, Islamic Rep.IraqIrelandIsraelItalyJamaicaJapanJordanKazakhstanKenyaKiribatiKorea, Rep.KuwaitKyrgyz RepublicLao PDRLate-demographic dividendLatin America & Caribbean Latin America & Caribbean (excluding high income)Latin America & the Caribbean (IDA & IBRD countries)LatviaLeast developed countries: UN classificationLebanonLesothoLiberiaLibyaLithuaniaLow & middle incomeLow incomeLower middle incomeLuxembourgMacao SAR, ChinaMacedonia, FYRMadagascarMalawiMalaysiaMaldivesMaliMaltaMarshall IslandsMauritaniaMauritiusMexicoMicronesia, Fed. Sts.Middle East & North AfricaMiddle East & North Africa (excluding high income)Middle East & North Africa (IDA & IBRD countries)Middle incomeMoldovaMongoliaMontenegroMoroccoMozambiqueMyanmarNamibiaNepalNetherlandsNew CaledoniaNew ZealandNicaraguaNigerNigeriaNorth AmericaNorwayOECD membersOmanOther small statesPacific island small statesPakistanPalauPanamaPapua New GuineaParaguayPeruPhilippinesPolandPortugalPost-demographic dividendPre-demographic dividendQatarRomaniaRussian FederationRwandaSamoaSao Tome and PrincipeSaudi ArabiaSenegalSerbiaSeychellesSierra LeoneSingaporeSlovak RepublicSloveniaSmall statesSolomon IslandsSouth AfricaSouth AsiaSouth Asia (IDA & IBRD)SpainSri LankaSt. Kitts and NevisSt. LuciaSt. Vincent and the GrenadinesSub-Saharan Africa Sub-Saharan Africa (excluding high income)Sub-Saharan Africa (IDA & IBRD countries)SudanSurinameSwazilandSwedenSwitzerlandSyrian Arab RepublicTajikistanTanzaniaThailandTimor-LesteTogoTongaTrinidad and TobagoTunisiaTurkeyTurkmenistanTuvaluUgandaUkraineUnited Arab EmiratesUnited KingdomUnited StatesUpper middle incomeUruguayUzbekistanVanuatuVenezuela, RBVietnamWorldYemen, Rep.ZambiaZimbabwe línea de tiempo (timeline):
En esta escala de tiempo se presenta un gráfico de 1961 y 2015 de Cote d'Ivoire. Los datos de 1960 están ausentes. El número de observaciones reales por fecha: 55.
Fuente (nombre):
Indicadores del desarrollo mundial
Fuente (organización):
World Trade Organization, and World Bank GDP estimates.
Categorías:
Private Sector, Trade
Se ha actualizado:
23 abr 2017 año
Los indicadores de los cambios de valor en los últimos años
Mínimo:
41.953
1 ene 1994 año
Máximo:
82.3
1 ene 2014 año
A la fecha de observación
Valor
Cambio absoluto
El cambio con respecto al valor anterior
1 ene 1961 año
52.784
+52.784
0.0%
1 ene 1962 año
58.578
+5.794
10.98%
1 ene 1963 año
54.128
-4.451
-7.6%
1 ene 1964 año
52.575
-1.553
-2.87%
1 ene 1965 año
57.748
+5.173
9.84%
1 ene 1966 año
55.83
-1.918
-3.32%
1 ene 1967 año
55.162
-0.668
-1.2%
1 ene 1968 año
54.358
-0.804
-1.46%
1 ene 1969 año
57.138
+2.78
5.11%
1 ene 1970 año
57.71
+0.572
1.0%
1 ene 1971 año
58.854
+1.144
1.98%
1 ene 1972 año
54.105
-4.749
-8.07%
1 ene 1973 año
54.484
+0.379
0.7%
1 ene 1974 año
62.475
+7.99
14.67%
1 ene 1975 año
71.058
+8.583
13.74%
1 ene 1976 año
59.265
-11.793
-16.6%
1 ene 1977 año
62.805
+3.541
5.97%
1 ene 1978 año
62.465
-0.34
-0.54%
1 ene 1979 año
58.824
-3.641
-5.83%
1 ene 1980 año
54.752
-4.072
-6.92%
1 ene 1981 año
59.957
+5.205
9.51%
1 ene 1982 año
58.286
-1.671
-2.79%
1 ene 1983 año
59.864
+1.579
2.71%
1 ene 1984 año
57.457
-2.408
-4.02%
1 ene 1985 año
61.418
+3.961
6.89%
1 ene 1986 año
70.883
+9.465
15.41%
1 ene 1987 año
59.061
-11.822
-16.68%
1 ene 1988 año
54.314
-4.747
-8.04%
1 ene 1989 año
47.274
-7.04
-12.96%
1 ene 1990 año
50.403
+3.129
6.62%
1 ene 1991 año
47.88
-2.523
-5.01%
1 ene 1992 año
45.642
-2.238
-4.67%
1 ene 1993 año
46.866
+1.225
2.68%
1 ene 1994 año
41.953
-4.914
-10.48%
1 ene 1995 año
56.041
+14.088
33.58%
1 ene 1996 año
61.245
+5.204
9.29%
1 ene 1997 año
60.531
-0.714
-1.17%
1 ene 1998 año
61.695
+1.164
1.92%
1 ene 1999 año
60.236
-1.459
-2.36%
1 ene 2000 año
61.072
+0.836
1.39%
1 ene 2001 año
59.44
-1.632
-2.67%
1 ene 2002 año
58.019
-1.42
-2.39%
1 ene 2003 año
63.773
+5.754
9.92%
1 ene 2004 año
59.236
-4.537
-7.11%
1 ene 2005 año
70.276
+11.04
18.64%
1 ene 2006 año
79.382
+9.106
12.96%
1 ene 2007 año
80.319
+0.937
1.18%
1 ene 2008 año
75.463
-4.855
-6.05%
1 ene 2009 año
75.433
-0.03
-0.04%
1 ene 2010 año
75.324
-0.109
-0.14%
1 ene 2011 año
77.396
+2.071
2.75%
1 ene 2012 año
76.257
-1.139
-1.47%
1 ene 2013 año
80.964
+4.708
6.17%
1 ene 2014 año
82.3
+1.335
1.65%
1 ene 2015 año
69.105
-13.195
-16.03%
Ranking de los países por los datos estadísticos actuales


Comentarios: