29
/es/
es
AIzaSyAYiBZKx7MnpbEhh9jyipgxe19OcubqV5w
April 1, 2024
265485
Tonga
TON
true
2
1
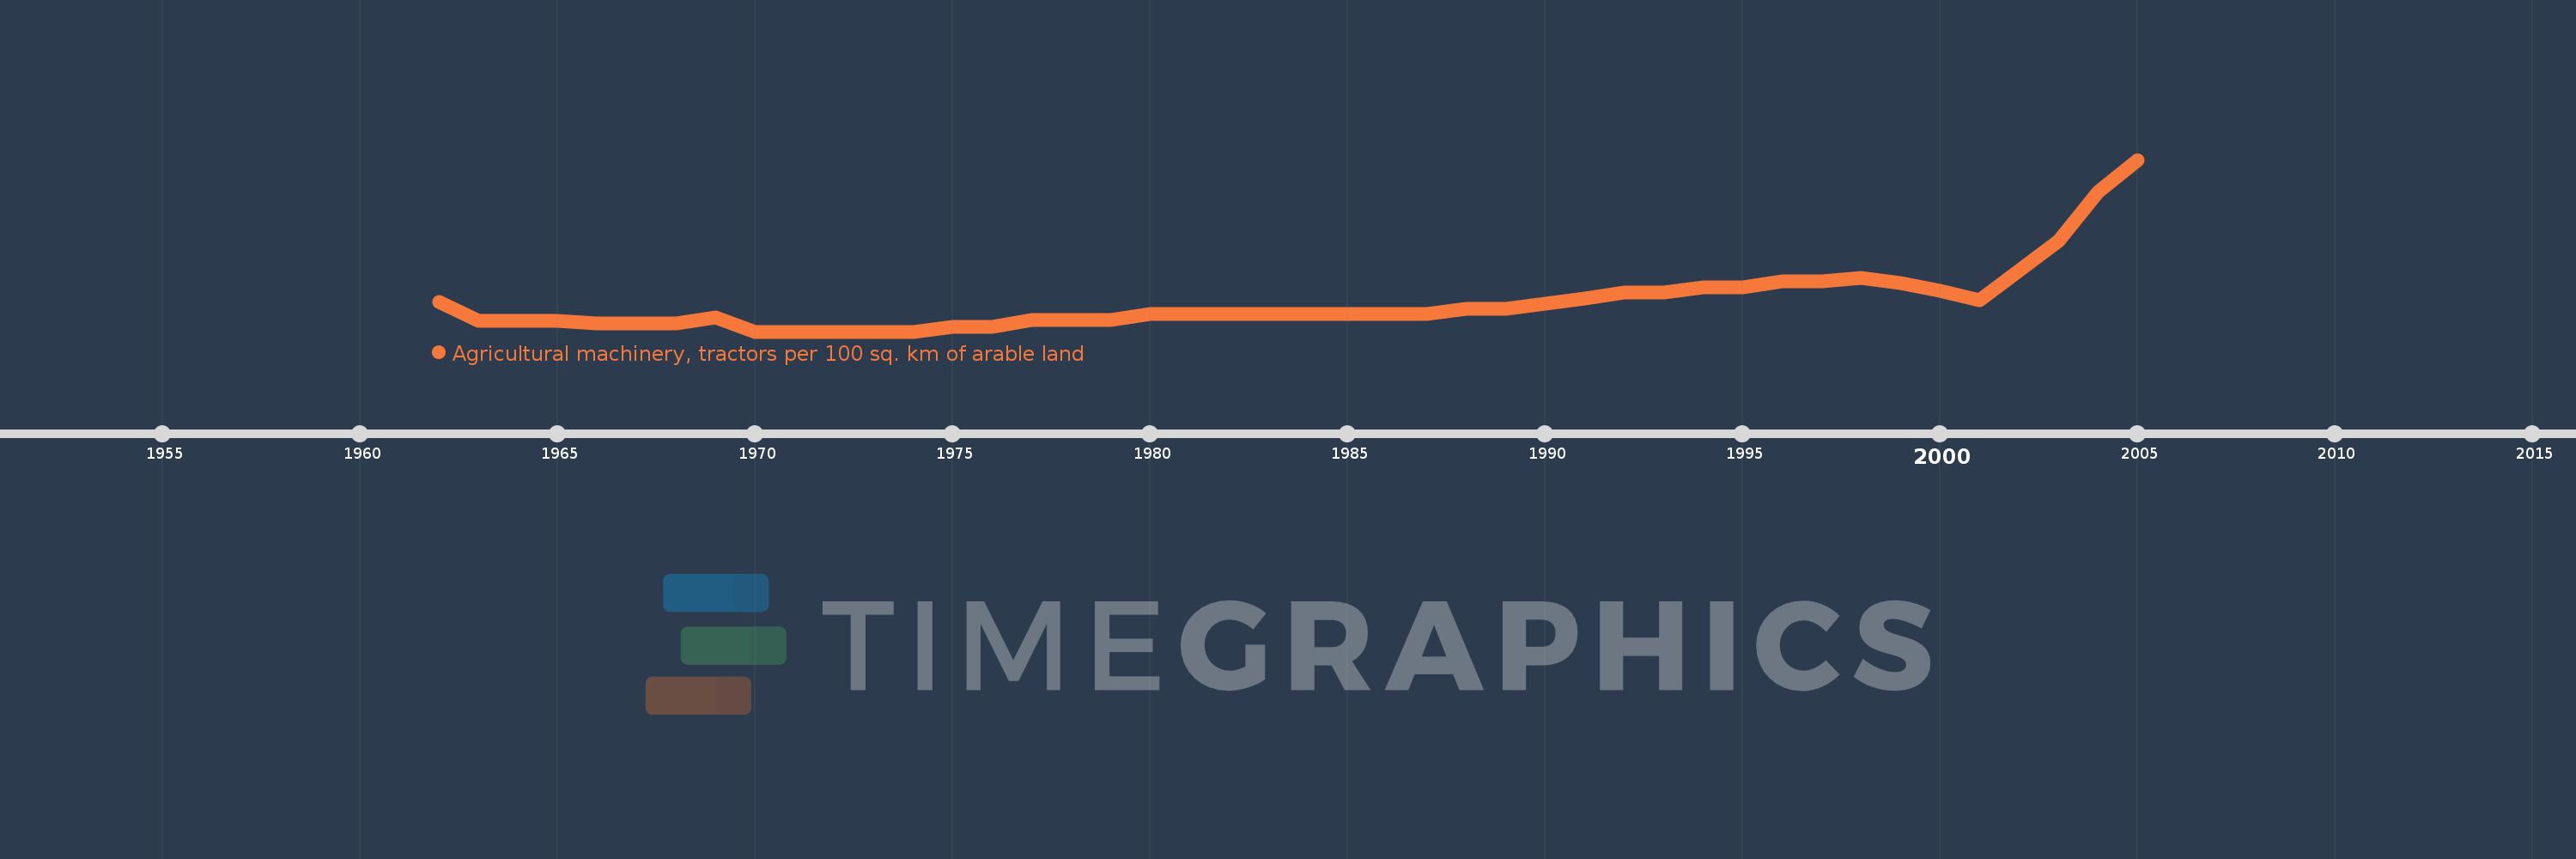
Agricultural machinery, tractors per 100 sq. km of arable land
2005,2004,2003,2001,2000,1999,1998,1997,1996,1995,1994,1993,1992,1991,1990,1989,1988,1987,1986,1985,1984,1983,1982,1981,1980,1979,1978,1977,1976,1975,1974,1973,1972,1971,1970,1969,1968,1967,1966,1965,1964,1963,1962
Estas estadísticas en otros países:
AfghanistanAlbaniaAlgeriaAmerican SamoaAndorraAngolaAntigua and BarbudaArab WorldArgentinaArmeniaAustraliaAustriaAzerbaijanBahamas, TheBahrainBangladeshBarbadosBelarusBelgiumBelizeBeninBermudaBhutanBoliviaBosnia and HerzegovinaBotswanaBrazilBritish Virgin IslandsBrunei DarussalamBulgariaBurkina FasoBurundiCabo VerdeCambodiaCameroonCanadaCaribbean small statesCentral African RepublicCentral Europe and the BalticsChadChileChinaColombiaCongo, Dem. Rep.Congo, Rep.Costa RicaCote d'IvoireCroatiaCubaCyprusCzech RepublicDenmarkDjiboutiDominicaDominican RepublicEarly-demographic dividendEast Asia & PacificEast Asia & Pacific (excluding high income)East Asia & Pacific (IDA & IBRD countries)EcuadorEgypt, Arab Rep.El SalvadorEritreaEstoniaEuro areaEurope & Central AsiaEurope & Central Asia (excluding high income)Europe & Central Asia (IDA & IBRD countries)European UnionFijiFinlandFragile and conflict affected situationsFranceFrench PolynesiaGambia, TheGeorgiaGermanyGhanaGreeceGrenadaGuamGuatemalaGuineaGuinea-BissauGuyanaHaitiHeavily indebted poor countries (HIPC)High incomeHondurasHungaryIBRD onlyIcelandIDA & IBRD totalIDA blendIDA onlyIDA totalIndiaIndonesiaIran, Islamic Rep.IraqIrelandIsraelItalyJamaicaJapanJordanKazakhstanKenyaKiribatiKorea, Dem. People’s Rep.Korea, Rep.KuwaitKyrgyz RepublicLao PDRLate-demographic dividendLatin America & Caribbean Latin America & Caribbean (excluding high income)Latin America & the Caribbean (IDA & IBRD countries)LatviaLeast developed countries: UN classificationLebanonLesothoLibyaLiechtensteinLithuaniaLow & middle incomeLow incomeLower middle incomeLuxembourgMacedonia, FYRMadagascarMalawiMalaysiaMaliMaltaMauritaniaMauritiusMexicoMiddle East & North AfricaMiddle East & North Africa (excluding high income)Middle East & North Africa (IDA & IBRD countries)Middle incomeMoldovaMongoliaMoroccoMozambiqueMyanmarNepalNetherlandsNew CaledoniaNew ZealandNicaraguaNigerNigeriaNorth AmericaNorthern Mariana IslandsNorwayOECD membersOmanOther small statesPakistanPanamaPapua New GuineaParaguayPeruPhilippinesPolandPortugalPost-demographic dividendPre-demographic dividendPuerto RicoQatarRomaniaRussian FederationRwandaSamoaSao Tome and PrincipeSaudi ArabiaSenegalSerbiaSeychellesSierra LeoneSlovak RepublicSloveniaSmall statesSolomon IslandsSomaliaSouth AfricaSouth AsiaSouth Asia (IDA & IBRD)SpainSri LankaSt. Kitts and NevisSt. LuciaSt. Vincent and the GrenadinesSub-Saharan Africa Sub-Saharan Africa (excluding high income)Sub-Saharan Africa (IDA & IBRD countries)SudanSurinameSwazilandSwedenSwitzerlandSyrian Arab RepublicTajikistanTanzaniaThailandTimor-LesteTogoTongaTrinidad and TobagoTunisiaTurkeyTurkmenistanUgandaUkraineUnited Arab EmiratesUnited KingdomUnited StatesUpper middle incomeUruguayVanuatuVenezuela, RBVietnamVirgin Islands (U.S.)West Bank and GazaWorldYemen, Rep.ZambiaZimbabwe línea de tiempo (timeline):
En esta escala de tiempo se presenta un gráfico de 1962 y 2005 de Tonga. Los datos de 1961 están ausentes. El número de observaciones reales por fecha: 43.
Fuente (nombre):
Indicadores del desarrollo mundial
Fuente (organización):
Food and Agriculture Organization, electronic files and web site.
Categorías:
Agriculture & Rural Development
Se ha actualizado:
23 abr 2017 año
Los indicadores de los cambios de valor en los últimos años
Mínimo:
61.765
1 ene 1970 año
Máximo:
162.0
1 ene 2005 año
A la fecha de observación
Valor
Cambio absoluto
El cambio con respecto al valor anterior
1 ene 1962 año
79.167
+79.167
0.0%
1 ene 1963 año
67.857
-11.31
-14.29%
1 ene 1964 año
67.857
0.0
0.0%
1 ene 1965 año
67.857
0.0
0.0%
1 ene 1966 año
66.667
-1.19
-1.75%
1 ene 1967 año
66.667
0.0
0.0%
1 ene 1968 año
66.667
0.0
0.0%
1 ene 1969 año
70.0
+3.333
5.0%
1 ene 1970 año
61.765
-8.235
-11.76%
1 ene 1971 año
61.765
0.0
0.0%
1 ene 1972 año
61.765
0.0
0.0%
1 ene 1973 año
61.765
0.0
0.0%
1 ene 1974 año
61.765
0.0
0.0%
1 ene 1975 año
64.706
+2.941
4.76%
1 ene 1976 año
64.706
0.0
0.0%
1 ene 1977 año
68.75
+4.044
6.25%
1 ene 1978 año
68.75
0.0
0.0%
1 ene 1979 año
68.75
0.0
0.0%
1 ene 1980 año
71.875
+3.125
4.55%
1 ene 1981 año
71.875
0.0
0.0%
1 ene 1982 año
71.875
0.0
0.0%
1 ene 1983 año
71.875
0.0
0.0%
1 ene 1984 año
71.875
0.0
0.0%
1 ene 1985 año
71.875
0.0
0.0%
1 ene 1986 año
71.875
0.0
0.0%
1 ene 1987 año
71.875
0.0
0.0%
1 ene 1988 año
75.0
+3.125
4.35%
1 ene 1989 año
75.0
0.0
0.0%
1 ene 1990 año
78.125
+3.125
4.17%
1 ene 1991 año
81.25
+3.125
4.0%
1 ene 1992 año
84.375
+3.125
3.85%
1 ene 1993 año
84.375
0.0
0.0%
1 ene 1994 año
87.5
+3.125
3.7%
1 ene 1995 año
87.5
0.0
0.0%
1 ene 1996 año
91.25
+3.75
4.29%
1 ene 1997 año
91.25
0.0
0.0%
1 ene 1998 año
93.333
+2.083
2.28%
1 ene 1999 año
90.0
-3.333
-3.57%
1 ene 2000 año
85.333
-4.667
-5.19%
1 ene 2001 año
80.0
-5.333
-6.25%
1 ene 2003 año
114.667
+34.667
43.33%
1 ene 2004 año
143.333
+28.667
25.0%
1 ene 2005 año
162.0
+18.667
13.02%
Ranking de los países por los datos estadísticos actuales


Comentarios: