29
/es/
es
AIzaSyAYiBZKx7MnpbEhh9jyipgxe19OcubqV5w
April 1, 2024
161192
Italy
ITA
true
2
1
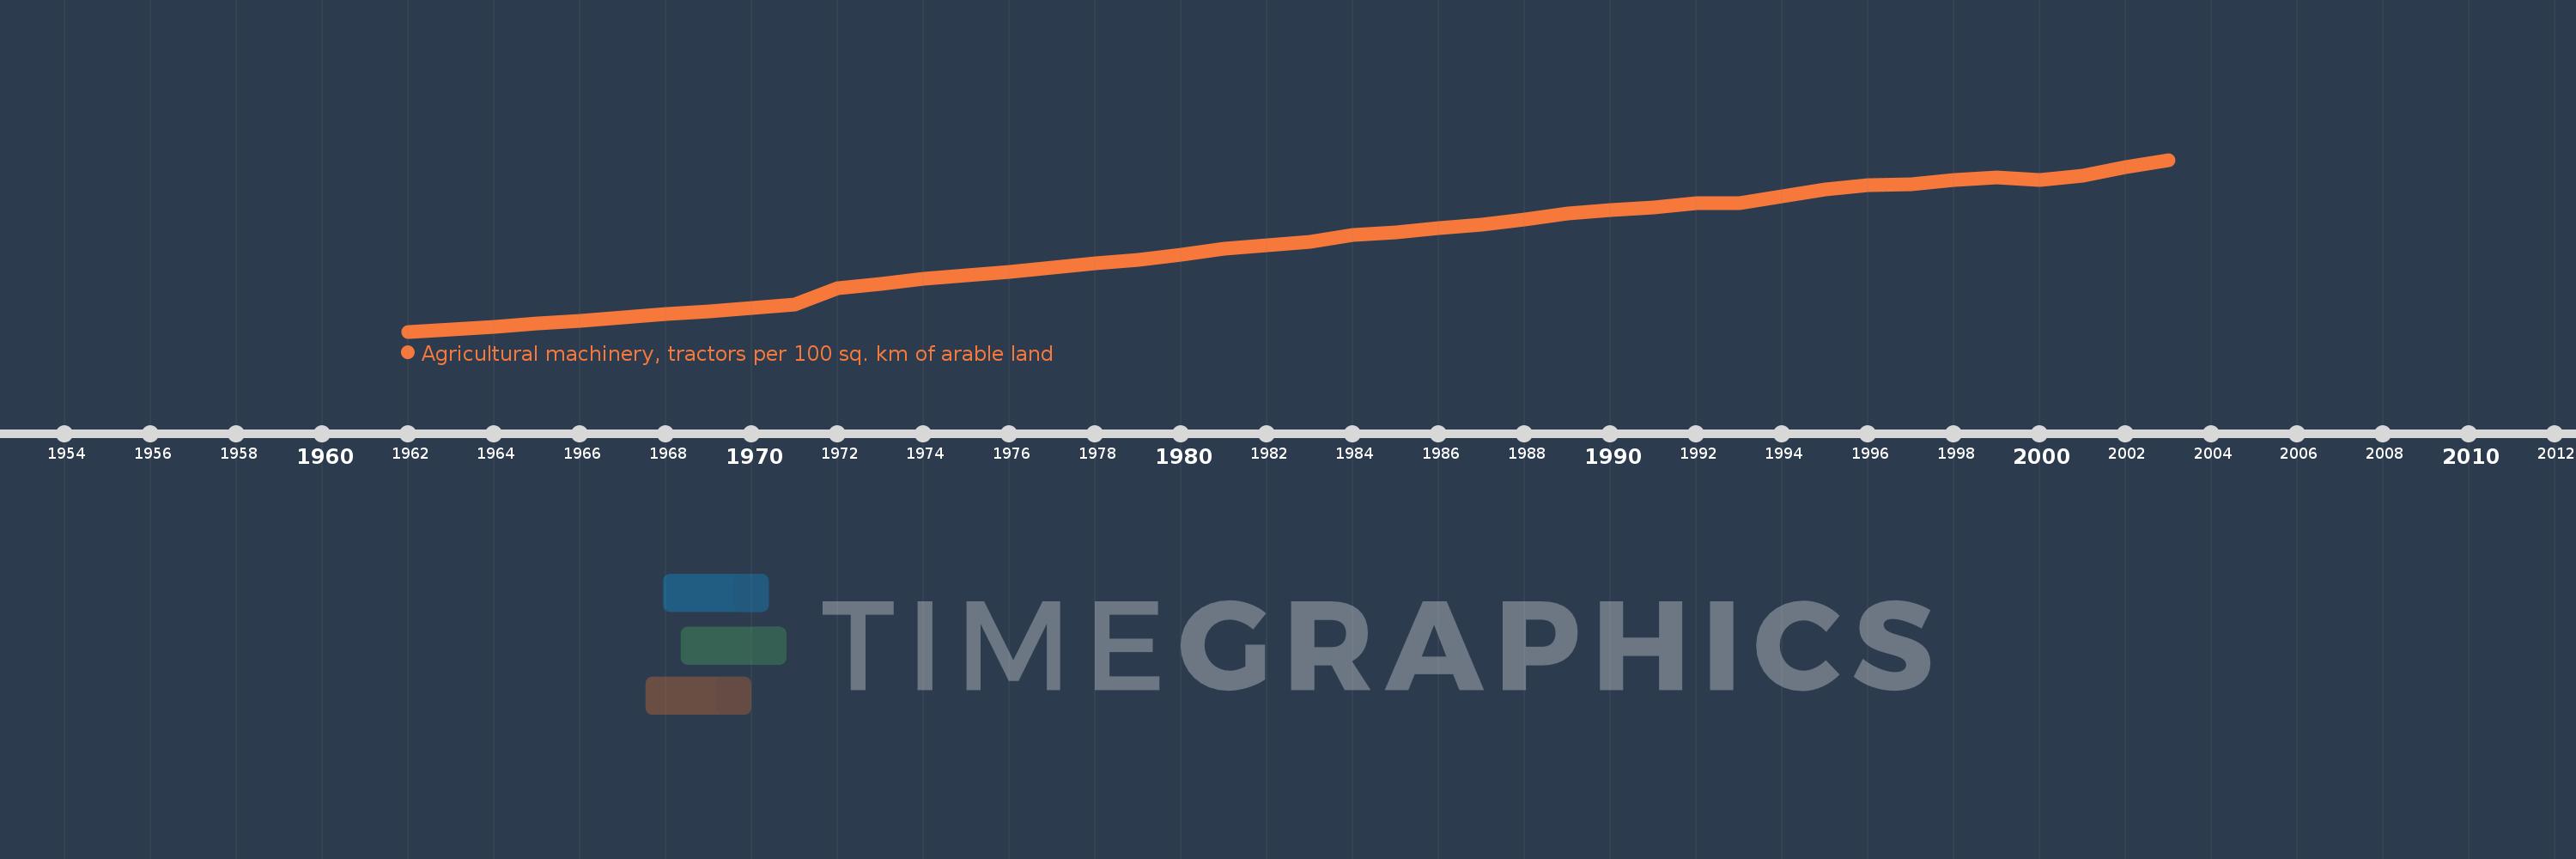
Agricultural machinery, tractors per 100 sq. km of arable land
2003,2002,2001,2000,1999,1998,1997,1996,1995,1994,1993,1992,1991,1990,1989,1988,1987,1986,1985,1984,1983,1982,1981,1980,1979,1978,1977,1976,1975,1974,1973,1972,1971,1970,1969,1968,1967,1966,1965,1964,1963,1962
Estas estadísticas en otros países:
AfghanistanAlbaniaAlgeriaAmerican SamoaAndorraAngolaAntigua and BarbudaArab WorldArgentinaArmeniaAustraliaAustriaAzerbaijanBahamas, TheBahrainBangladeshBarbadosBelarusBelgiumBelizeBeninBermudaBhutanBoliviaBosnia and HerzegovinaBotswanaBrazilBritish Virgin IslandsBrunei DarussalamBulgariaBurkina FasoBurundiCabo VerdeCambodiaCameroonCanadaCaribbean small statesCentral African RepublicCentral Europe and the BalticsChadChileChinaColombiaCongo, Dem. Rep.Congo, Rep.Costa RicaCote d'IvoireCroatiaCubaCyprusCzech RepublicDenmarkDjiboutiDominicaDominican RepublicEarly-demographic dividendEast Asia & PacificEast Asia & Pacific (excluding high income)East Asia & Pacific (IDA & IBRD countries)EcuadorEgypt, Arab Rep.El SalvadorEritreaEstoniaEuro areaEurope & Central AsiaEurope & Central Asia (excluding high income)Europe & Central Asia (IDA & IBRD countries)European UnionFijiFinlandFragile and conflict affected situationsFranceFrench PolynesiaGambia, TheGeorgiaGermanyGhanaGreeceGrenadaGuamGuatemalaGuineaGuinea-BissauGuyanaHaitiHeavily indebted poor countries (HIPC)High incomeHondurasHungaryIBRD onlyIcelandIDA & IBRD totalIDA blendIDA onlyIDA totalIndiaIndonesiaIran, Islamic Rep.IraqIrelandIsraelItalyJamaicaJapanJordanKazakhstanKenyaKiribatiKorea, Dem. People’s Rep.Korea, Rep.KuwaitKyrgyz RepublicLao PDRLate-demographic dividendLatin America & Caribbean Latin America & Caribbean (excluding high income)Latin America & the Caribbean (IDA & IBRD countries)LatviaLeast developed countries: UN classificationLebanonLesothoLibyaLiechtensteinLithuaniaLow & middle incomeLow incomeLower middle incomeLuxembourgMacedonia, FYRMadagascarMalawiMalaysiaMaliMaltaMauritaniaMauritiusMexicoMiddle East & North AfricaMiddle East & North Africa (excluding high income)Middle East & North Africa (IDA & IBRD countries)Middle incomeMoldovaMongoliaMoroccoMozambiqueMyanmarNepalNetherlandsNew CaledoniaNew ZealandNicaraguaNigerNigeriaNorth AmericaNorthern Mariana IslandsNorwayOECD membersOmanOther small statesPakistanPanamaPapua New GuineaParaguayPeruPhilippinesPolandPortugalPost-demographic dividendPre-demographic dividendPuerto RicoQatarRomaniaRussian FederationRwandaSamoaSao Tome and PrincipeSaudi ArabiaSenegalSerbiaSeychellesSierra LeoneSlovak RepublicSloveniaSmall statesSolomon IslandsSomaliaSouth AfricaSouth AsiaSouth Asia (IDA & IBRD)SpainSri LankaSt. Kitts and NevisSt. LuciaSt. Vincent and the GrenadinesSub-Saharan Africa Sub-Saharan Africa (excluding high income)Sub-Saharan Africa (IDA & IBRD countries)SudanSurinameSwazilandSwedenSwitzerlandSyrian Arab RepublicTajikistanTanzaniaThailandTimor-LesteTogoTongaTrinidad and TobagoTunisiaTurkeyTurkmenistanUgandaUkraineUnited Arab EmiratesUnited KingdomUnited StatesUpper middle incomeUruguayVanuatuVenezuela, RBVietnamVirgin Islands (U.S.)West Bank and GazaWorldYemen, Rep.ZambiaZimbabwe línea de tiempo (timeline):
En esta escala de tiempo se presenta un gráfico de 1962 y 2003 de Italy. Los datos de 1961 están ausentes. El número de observaciones reales por fecha: 42.
Fuente (nombre):
Indicadores del desarrollo mundial
Fuente (organización):
Food and Agriculture Organization, electronic files and web site.
Categorías:
Agriculture & Rural Development
Se ha actualizado:
23 abr 2017 año
Los indicadores de los cambios de valor en los últimos años
Mínimo:
212.136
1 ene 1962 año
Máximo:
2.117 mil
1 ene 2003 año
A la fecha de observación
Valor
Cambio absoluto
El cambio con respecto al valor anterior
1 ene 1962 año
212.136
+212.136
0.0%
1 ene 1963 año
238.291
+26.155
12.33%
1 ene 1964 año
267.148
+28.858
12.11%
1 ene 1965 año
299.339
+32.19
12.05%
1 ene 1966 año
335.311
+35.972
12.02%
1 ene 1967 año
370.374
+35.063
10.46%
1 ene 1968 año
411.037
+40.664
10.98%
1 ene 1969 año
439.649
+28.612
6.96%
1 ene 1970 año
478.041
+38.392
8.73%
1 ene 1971 año
512.944
+34.903
7.3%
1 ene 1972 año
691.062
+178.118
34.72%
1 ene 1973 año
743.403
+52.341
7.57%
1 ene 1974 año
799.705
+56.302
7.57%
1 ene 1975 año
837.646
+37.941
4.74%
1 ene 1976 año
878.171
+40.526
4.84%
1 ene 1977 año
924.514
+46.343
5.28%
1 ene 1978 año
971.877
+47.363
5.12%
1 ene 1979 año
1.009 mil
+36.69
3.78%
1 ene 1980 año
1.062 mil
+53.146
5.27%
1 ene 1981 año
1.131 mil
+68.907
6.49%
1 ene 1982 año
1.168 mil
+37.341
3.3%
1 ene 1983 año
1.204 mil
+36.362
3.11%
1 ene 1984 año
1.281 mil
+76.912
6.39%
1 ene 1985 año
1.317 mil
+35.679
2.78%
1 ene 1986 año
1.356 mil
+39.034
2.96%
1 ene 1987 año
1.397 mil
+40.867
3.01%
1 ene 1988 año
1.451 mil
+54.289
3.89%
1 ene 1989 año
1.521 mil
+70.364
4.85%
1 ene 1990 año
1.556 mil
+34.602
2.27%
1 ene 1991 año
1.587 mil
+30.431
1.96%
1 ene 1992 año
1.636 mil
+49.24
3.1%
1 ene 1993 año
1.636 mil
-0.022
0.0%
1 ene 1994 año
1.713 mil
+76.936
4.7%
1 ene 1995 año
1.79 mil
+77.194
4.51%
1 ene 1996 año
1.838 mil
+48.206
2.69%
1 ene 1997 año
1.85 mil
+11.711
0.64%
1 ene 1998 año
1.892 mil
+42.105
2.28%
1 ene 1999 año
1.922 mil
+30.356
1.6%
1 ene 2000 año
1.896 mil
-26.286
-1.37%
1 ene 2001 año
1.938 mil
+42.508
2.24%
1 ene 2002 año
2.034 mil
+95.352
4.92%
1 ene 2003 año
2.117 mil
+83.248
4.09%
Ranking de los países por los datos estadísticos actuales


Comentarios: