29
/es/
es
AIzaSyAYiBZKx7MnpbEhh9jyipgxe19OcubqV5w
April 1, 2024
133829
France
FRA
true
2
1
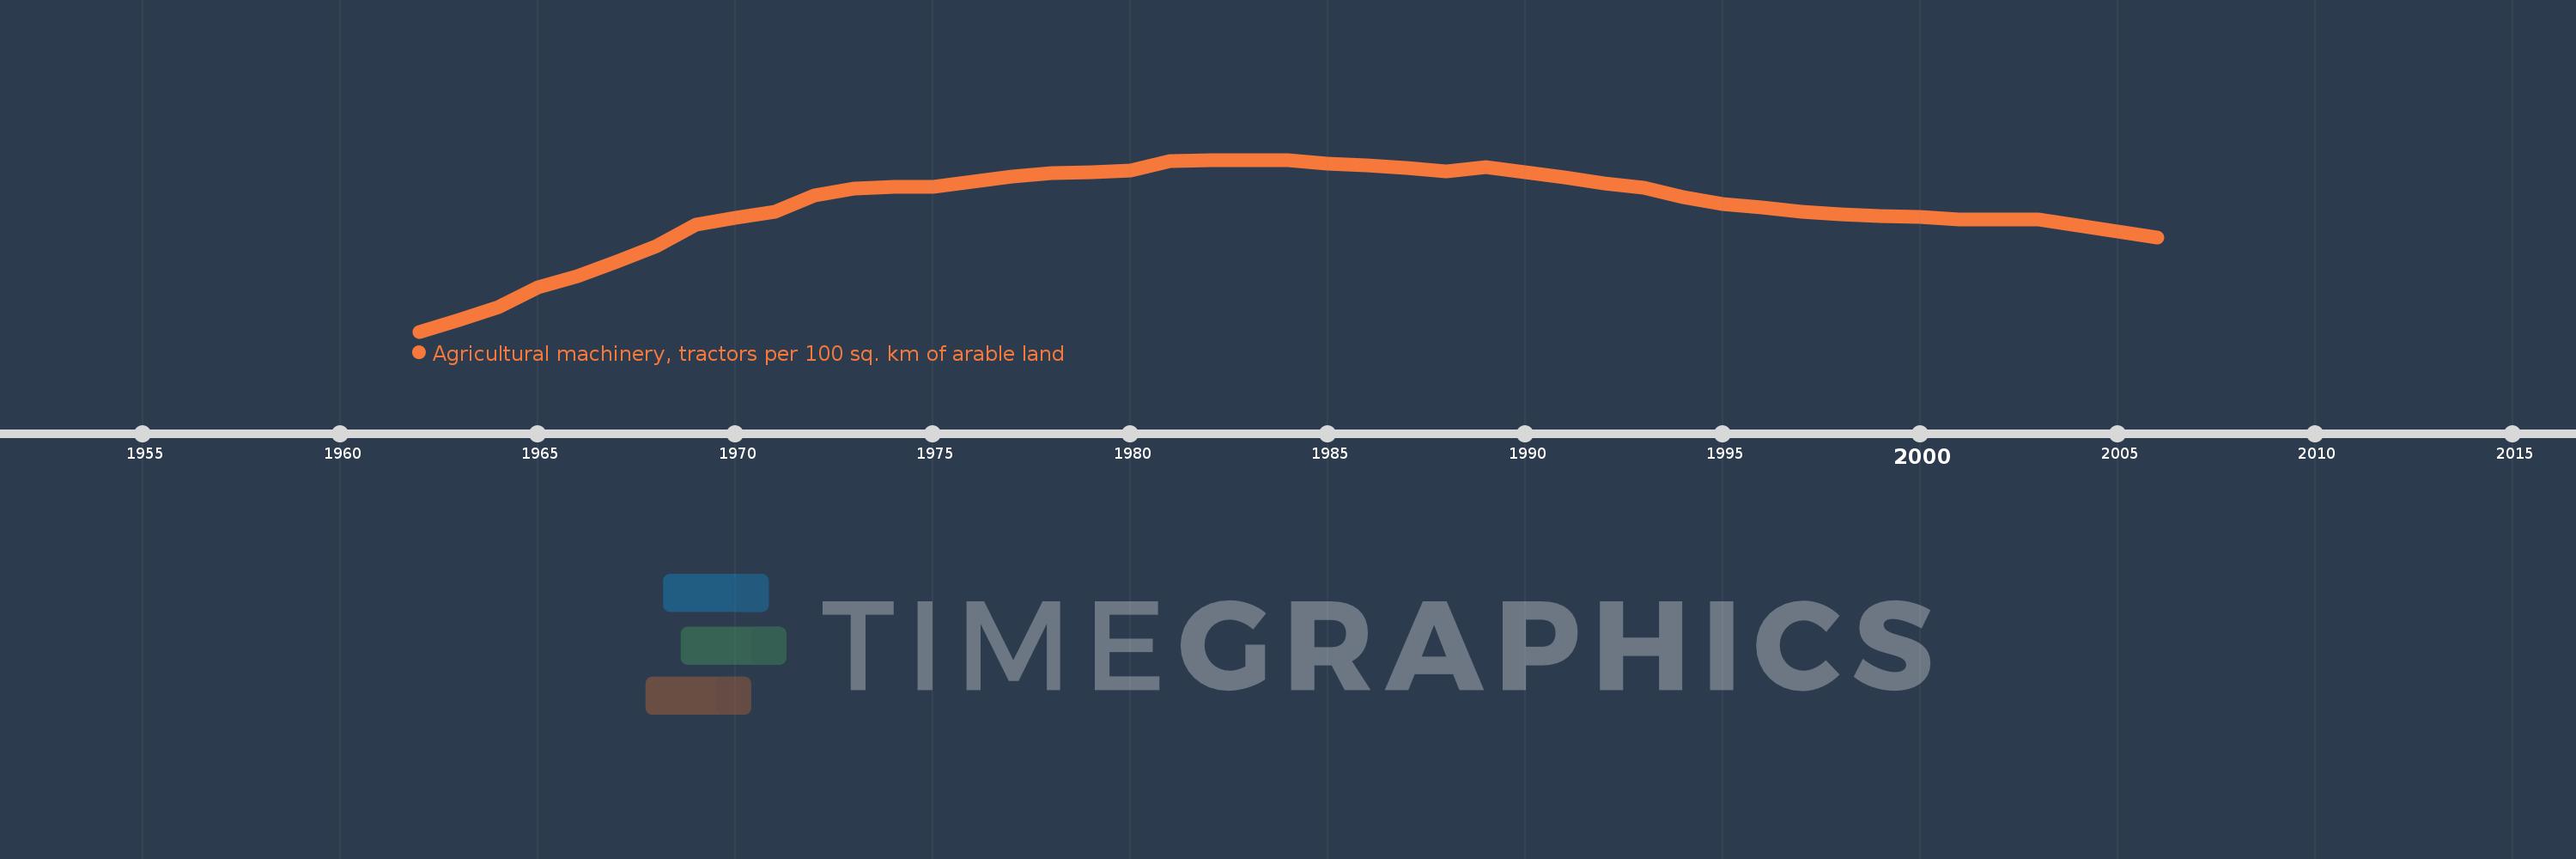
Agricultural machinery, tractors per 100 sq. km of arable land
2006,2005,2004,2003,2002,2001,2000,1999,1998,1997,1996,1995,1994,1993,1992,1991,1990,1989,1988,1987,1986,1985,1984,1983,1982,1981,1980,1979,1978,1977,1976,1975,1974,1973,1972,1971,1970,1969,1968,1967,1966,1965,1964,1963,1962
Estas estadísticas en otros países:
AfghanistanAlbaniaAlgeriaAmerican SamoaAndorraAngolaAntigua and BarbudaArab WorldArgentinaArmeniaAustraliaAustriaAzerbaijanBahamas, TheBahrainBangladeshBarbadosBelarusBelgiumBelizeBeninBermudaBhutanBoliviaBosnia and HerzegovinaBotswanaBrazilBritish Virgin IslandsBrunei DarussalamBulgariaBurkina FasoBurundiCabo VerdeCambodiaCameroonCanadaCaribbean small statesCentral African RepublicCentral Europe and the BalticsChadChileChinaColombiaCongo, Dem. Rep.Congo, Rep.Costa RicaCote d'IvoireCroatiaCubaCyprusCzech RepublicDenmarkDjiboutiDominicaDominican RepublicEarly-demographic dividendEast Asia & PacificEast Asia & Pacific (excluding high income)East Asia & Pacific (IDA & IBRD countries)EcuadorEgypt, Arab Rep.El SalvadorEritreaEstoniaEuro areaEurope & Central AsiaEurope & Central Asia (excluding high income)Europe & Central Asia (IDA & IBRD countries)European UnionFijiFinlandFragile and conflict affected situationsFranceFrench PolynesiaGambia, TheGeorgiaGermanyGhanaGreeceGrenadaGuamGuatemalaGuineaGuinea-BissauGuyanaHaitiHeavily indebted poor countries (HIPC)High incomeHondurasHungaryIBRD onlyIcelandIDA & IBRD totalIDA blendIDA onlyIDA totalIndiaIndonesiaIran, Islamic Rep.IraqIrelandIsraelItalyJamaicaJapanJordanKazakhstanKenyaKiribatiKorea, Dem. People’s Rep.Korea, Rep.KuwaitKyrgyz RepublicLao PDRLate-demographic dividendLatin America & Caribbean Latin America & Caribbean (excluding high income)Latin America & the Caribbean (IDA & IBRD countries)LatviaLeast developed countries: UN classificationLebanonLesothoLibyaLiechtensteinLithuaniaLow & middle incomeLow incomeLower middle incomeLuxembourgMacedonia, FYRMadagascarMalawiMalaysiaMaliMaltaMauritaniaMauritiusMexicoMiddle East & North AfricaMiddle East & North Africa (excluding high income)Middle East & North Africa (IDA & IBRD countries)Middle incomeMoldovaMongoliaMoroccoMozambiqueMyanmarNepalNetherlandsNew CaledoniaNew ZealandNicaraguaNigerNigeriaNorth AmericaNorthern Mariana IslandsNorwayOECD membersOmanOther small statesPakistanPanamaPapua New GuineaParaguayPeruPhilippinesPolandPortugalPost-demographic dividendPre-demographic dividendPuerto RicoQatarRomaniaRussian FederationRwandaSamoaSao Tome and PrincipeSaudi ArabiaSenegalSerbiaSeychellesSierra LeoneSlovak RepublicSloveniaSmall statesSolomon IslandsSomaliaSouth AfricaSouth AsiaSouth Asia (IDA & IBRD)SpainSri LankaSt. Kitts and NevisSt. LuciaSt. Vincent and the GrenadinesSub-Saharan Africa Sub-Saharan Africa (excluding high income)Sub-Saharan Africa (IDA & IBRD countries)SudanSurinameSwazilandSwedenSwitzerlandSyrian Arab RepublicTajikistanTanzaniaThailandTimor-LesteTogoTongaTrinidad and TobagoTunisiaTurkeyTurkmenistanUgandaUkraineUnited Arab EmiratesUnited KingdomUnited StatesUpper middle incomeUruguayVanuatuVenezuela, RBVietnamVirgin Islands (U.S.)West Bank and GazaWorldYemen, Rep.ZambiaZimbabwe línea de tiempo (timeline):
En esta escala de tiempo se presenta un gráfico de 1962 y 2006 de France. Los datos de 1961 están ausentes. El número de observaciones reales por fecha: 45.
Fuente (nombre):
Indicadores del desarrollo mundial
Fuente (organización):
Food and Agriculture Organization, electronic files and web site.
Categorías:
Agriculture & Rural Development
Se ha actualizado:
23 abr 2017 año
Los indicadores de los cambios de valor en los últimos años
Mínimo:
379.17
1 ene 1962 año
Máximo:
847.084
1 ene 1982 año
A la fecha de observación
Valor
Cambio absoluto
El cambio con respecto al valor anterior
1 ene 1962 año
379.17
+379.17
0.0%
1 ene 1963 año
411.899
+32.729
8.63%
1 ene 1964 año
445.991
+34.093
8.28%
1 ene 1965 año
499.38
+53.389
11.97%
1 ene 1966 año
530.124
+30.744
6.16%
1 ene 1967 año
569.34
+39.216
7.4%
1 ene 1968 año
612.255
+42.915
7.54%
1 ene 1969 año
670.491
+58.236
9.51%
1 ene 1970 año
688.308
+17.817
2.66%
1 ene 1971 año
706.321
+18.013
2.62%
1 ene 1972 año
749.179
+42.858
6.07%
1 ene 1973 año
767.663
+18.484
2.47%
1 ene 1974 año
772.695
+5.032
0.66%
1 ene 1975 año
773.932
+1.237
0.16%
1 ene 1976 año
786.392
+12.46
1.61%
1 ene 1977 año
801.121
+14.728
1.87%
1 ene 1978 año
810.579
+9.458
1.18%
1 ene 1979 año
814.268
+3.69
0.46%
1 ene 1980 año
818.631
+4.363
0.54%
1 ene 1981 año
843.407
+24.775
3.03%
1 ene 1982 año
847.084
+3.678
0.44%
1 ene 1983 año
846.184
-0.9
-0.11%
1 ene 1984 año
846.115
-0.07
-0.01%
1 ene 1985 año
837.442
-8.673
-1.03%
1 ene 1986 año
832.004
-5.438
-0.65%
1 ene 1987 año
825.036
-6.967
-0.84%
1 ene 1988 año
815.269
-9.767
-1.18%
1 ene 1989 año
828.271
+13.002
1.59%
1 ene 1990 año
814.161
-14.11
-1.7%
1 ene 1991 año
800.044
-14.117
-1.73%
1 ene 1992 año
782.117
-17.928
-2.24%
1 ene 1993 año
770.254
-11.863
-1.52%
1 ene 1994 año
745.001
-25.252
-3.28%
1 ene 1995 año
726.141
-18.86
-2.53%
1 ene 1996 año
716.384
-9.757
-1.34%
1 ene 1997 año
705.381
-11.004
-1.54%
1 ene 1998 año
698.144
-7.236
-1.03%
1 ene 1999 año
694.467
-3.677
-0.53%
1 ene 2000 año
691.101
-3.366
-0.48%
1 ene 2001 año
685.466
-5.635
-0.82%
1 ene 2002 año
685.206
-0.26
-0.04%
1 ene 2003 año
685.132
-0.074
-0.01%
1 ene 2004 año
668.861
-16.271
-2.37%
1 ene 2005 año
652.89
-15.971
-2.39%
1 ene 2006 año
635.322
-17.568
-2.69%
Ranking de los países por los datos estadísticos actuales


Comentarios: