29
/es/
es
AIzaSyAYiBZKx7MnpbEhh9jyipgxe19OcubqV5w
April 1, 2024
262676
Thailand
THA
true
2
1
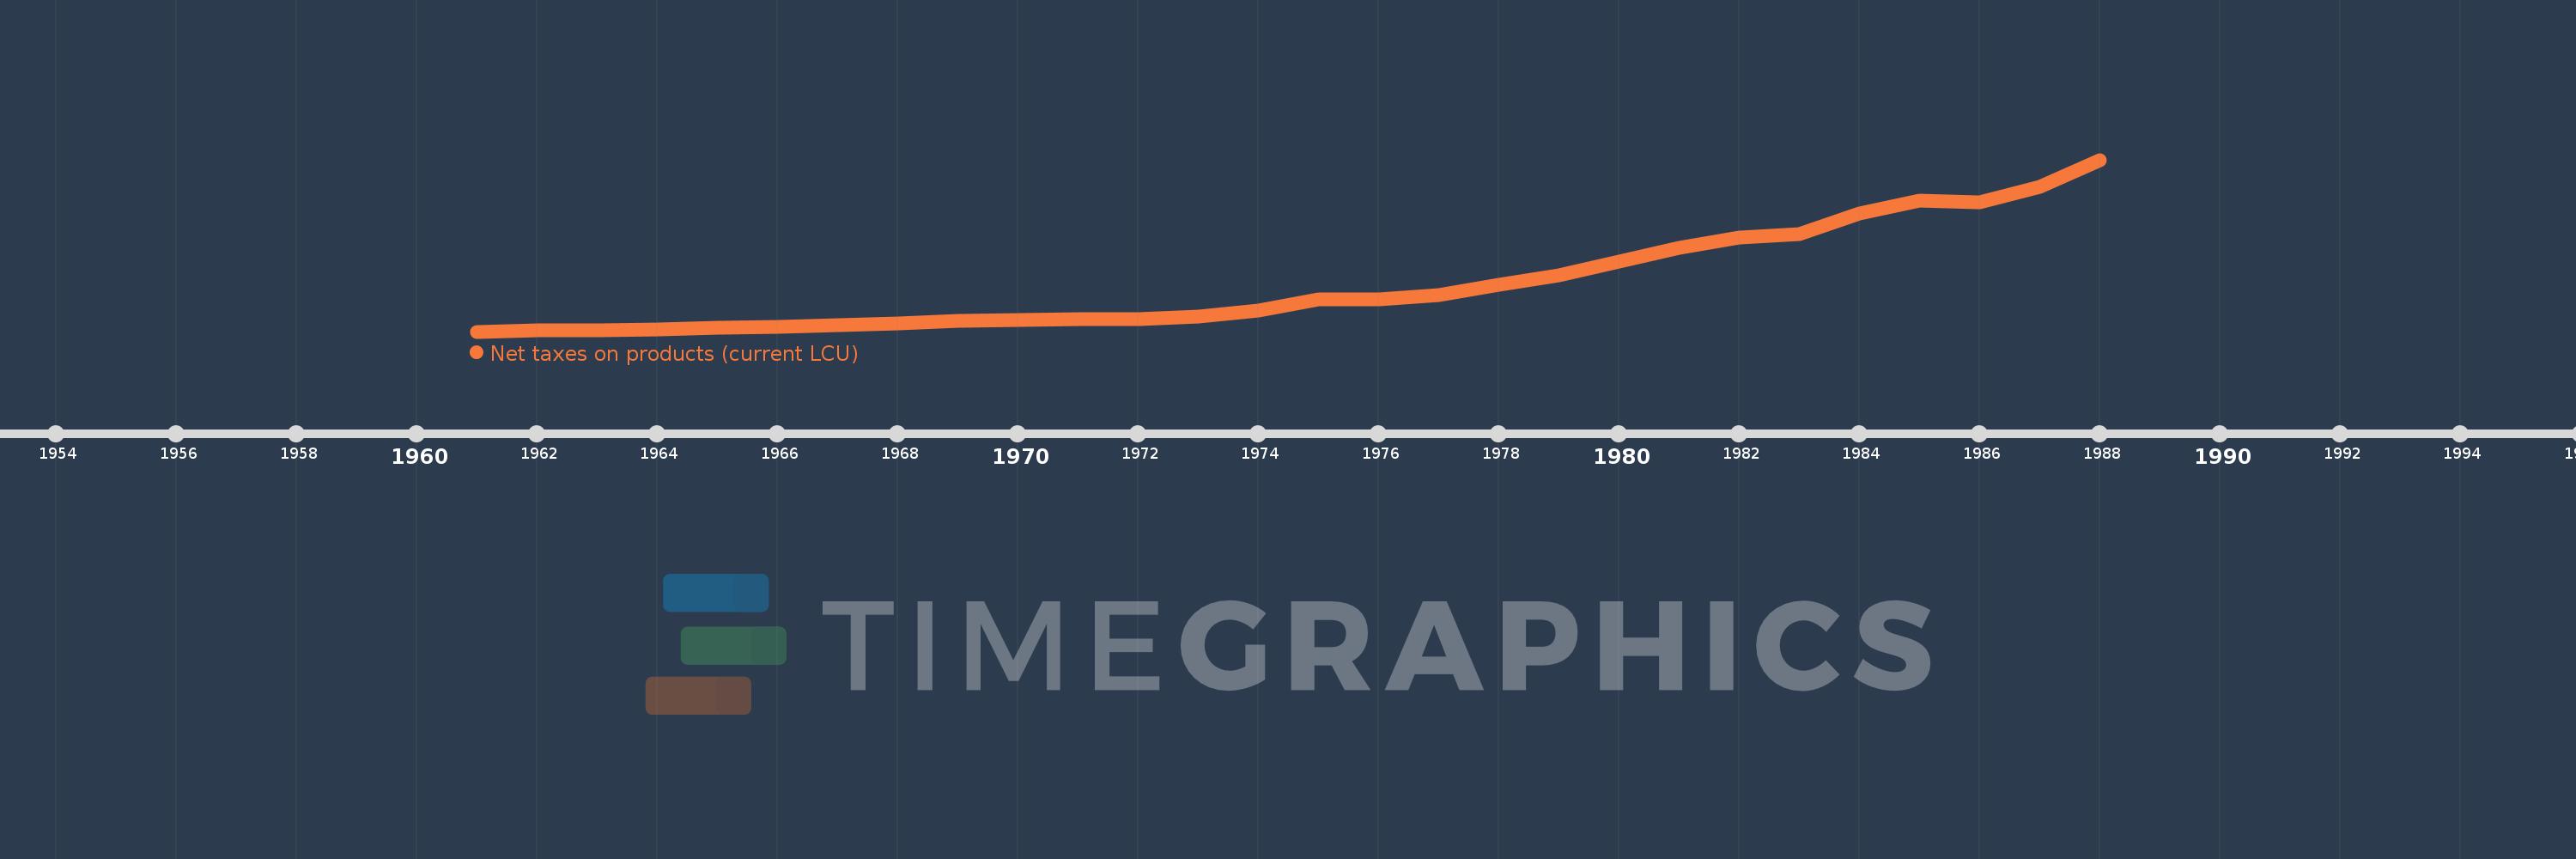
Net taxes on products (current LCU)
1988,1987,1986,1985,1984,1983,1982,1981,1980,1979,1978,1977,1976,1975,1974,1973,1972,1971,1970,1969,1968,1967,1966,1965,1964,1963,1962,1961
Estas estadísticas en otros países:
AfghanistanAlbaniaAlgeriaAndorraAntigua and BarbudaArgentinaArmeniaArubaAustraliaAustriaAzerbaijanBahamas, TheBahrainBangladeshBarbadosBelarusBelgiumBelizeBeninBermudaBhutanBoliviaBosnia and HerzegovinaBotswanaBrazilBulgariaBurkina FasoBurundiCabo VerdeCambodiaCameroonCanadaCentral African RepublicChadChileColombiaCongo, Dem. Rep.Costa RicaCroatiaCubaCyprusCzech RepublicDenmarkDjiboutiDominicaDominican RepublicEcuadorEgypt, Arab Rep.El SalvadorEquatorial GuineaEritreaEstoniaEthiopiaFaroe IslandsFijiFinlandFranceGabonGambia, TheGeorgiaGermanyGhanaGreeceGrenadaGuatemalaGuineaGuinea-BissauGuyanaHondurasHong Kong SAR, ChinaHungaryIndiaIndonesiaIran, Islamic Rep.IrelandItalyJamaicaJapanJordanKazakhstanKenyaKiribatiKorea, Rep.KosovoKyrgyz RepublicLao PDRLatviaLebanonLesothoLiberiaLiechtensteinLithuaniaLuxembourgMacao SAR, ChinaMacedonia, FYRMadagascarMalawiMalaysiaMaldivesMaliMarshall IslandsMauritaniaMauritiusMexicoMicronesia, Fed. Sts.MoldovaMongoliaMontenegroMoroccoMozambiqueNamibiaNepalNetherlandsNew ZealandNicaraguaNigerNigeriaNorwayOmanPakistanPalauPanamaPapua New GuineaParaguayPeruPolandPortugalRomaniaRussian FederationRwandaSao Tome and PrincipeSenegalSerbiaSeychellesSierra LeoneSingaporeSlovak RepublicSloveniaSolomon IslandsSomaliaSouth AfricaSpainSri LankaSt. Kitts and NevisSt. LuciaSt. Vincent and the GrenadinesSudanSurinameSwazilandSwedenSwitzerlandSyrian Arab RepublicTajikistanTanzaniaThailandTimor-LesteTongaTrinidad and TobagoTunisiaTurkeyTurkmenistanTuvaluUgandaUkraineUnited KingdomUnited StatesUruguayUzbekistanVanuatuVenezuela, RBVietnamWest Bank and GazaYemen, Rep.ZambiaZimbabwe línea de tiempo (timeline):
En esta escala de tiempo se presenta un gráfico de 1961 y 1988 de Thailand. Los datos de 1960 están ausentes. El número de observaciones reales por fecha: 28.
Fuente (nombre):
Indicadores del desarrollo mundial
Fuente (organización):
World Bank national accounts data, and OECD National Accounts data files.
Categorías:
Economy & Growth
Se ha actualizado:
23 abr 2017 año
Los indicadores de los cambios de valor en los últimos años
Mínimo:
5.87 bn
1 ene 1961 año
Máximo:
149.67 bn
1 ene 1988 año
A la fecha de observación
Valor
Cambio absoluto
El cambio con respecto al valor anterior
1 ene 1961 año
5.87 bn
+5.87 bn
0.0%
1 ene 1962 año
6.592 bn
+721.4 millones
12.29%
1 ene 1963 año
7.096 bn
+504.8 millones
7.66%
1 ene 1964 año
7.715 bn
+618.2 millones
8.71%
1 ene 1965 año
8.968 bn
+1.253 bn
16.25%
1 ene 1966 año
9.869 bn
+900.5 millones
10.04%
1 ene 1967 año
11.251 bn
+1.382 bn
14.01%
1 ene 1968 año
12.938 bn
+1.687 bn
15.0%
1 ene 1969 año
14.503 bn
+1.565 bn
12.1%
1 ene 1970 año
15.712 bn
+1.209 bn
8.34%
1 ene 1971 año
16.1 bn
+388.0 millones
2.47%
1 ene 1972 año
16.5 bn
+400.0 millones
2.48%
1 ene 1973 año
18.4 bn
+1.9 bn
11.52%
1 ene 1974 año
23.3 bn
+4.9 bn
26.63%
1 ene 1975 año
32.9 bn
+9.6 bn
41.2%
1 ene 1976 año
32.6 bn
-299.999 millones
-0.91%
1 ene 1977 año
36.3 bn
+3.7 bn
11.35%
1 ene 1978 año
44.8 bn
+8.5 bn
23.42%
1 ene 1979 año
52.9 bn
+8.1 bn
18.08%
1 ene 1980 año
64.5 bn
+11.6 bn
21.93%
1 ene 1981 año
76.233 bn
+11.733 bn
18.19%
1 ene 1982 año
84.725 bn
+8.492 bn
11.14%
1 ene 1983 año
87.338 bn
+2.613 bn
3.08%
1 ene 1984 año
104.502 bn
+17.164 bn
19.65%
1 ene 1985 año
115.719 bn
+11.217 bn
10.73%
1 ene 1986 año
113.969 bn
-1.75 bn
-1.51%
1 ene 1987 año
127.03 bn
+13.061 bn
11.46%
1 ene 1988 año
149.67 bn
+22.64 bn
17.82%
Ranking de los países por los datos estadísticos actuales


Comentarios: