29
/es/
es
AIzaSyAYiBZKx7MnpbEhh9jyipgxe19OcubqV5w
April 1, 2024
127656
Equatorial Guinea
GNQ
true
2
1
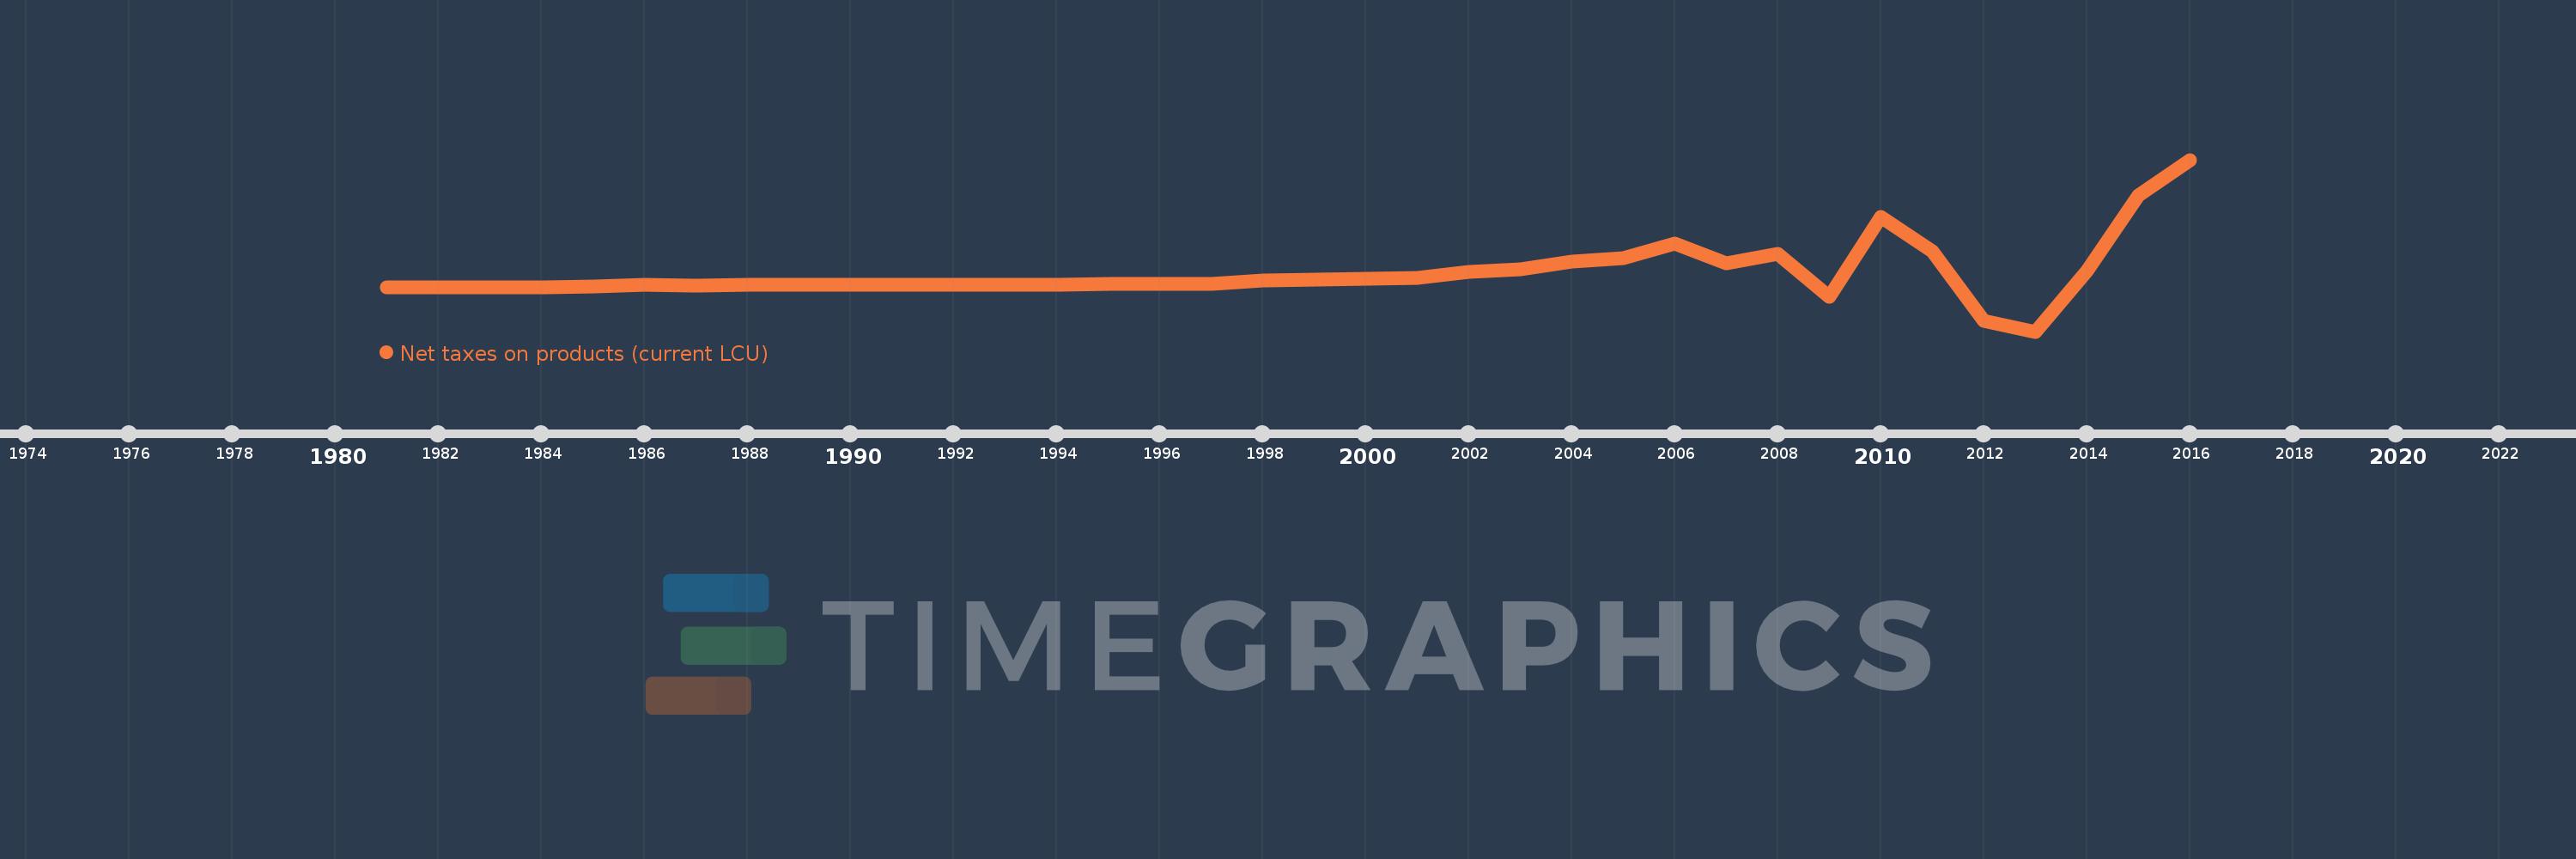
Net taxes on products (current LCU)
2016,2015,2014,2013,2012,2011,2010,2009,2008,2007,2006,2005,2004,2003,2002,2001,2000,1999,1998,1997,1996,1995,1994,1993,1992,1991,1990,1989,1988,1987,1986,1985,1984,1983,1982,1981
Estas estadísticas en otros países:
AfghanistanAlbaniaAlgeriaAndorraAntigua and BarbudaArgentinaArmeniaArubaAustraliaAustriaAzerbaijanBahamas, TheBahrainBangladeshBarbadosBelarusBelgiumBelizeBeninBermudaBhutanBoliviaBosnia and HerzegovinaBotswanaBrazilBulgariaBurkina FasoBurundiCabo VerdeCambodiaCameroonCanadaCentral African RepublicChadChileColombiaCongo, Dem. Rep.Costa RicaCroatiaCubaCyprusCzech RepublicDenmarkDjiboutiDominicaDominican RepublicEcuadorEgypt, Arab Rep.El SalvadorEquatorial GuineaEritreaEstoniaEthiopiaFaroe IslandsFijiFinlandFranceGabonGambia, TheGeorgiaGermanyGhanaGreeceGrenadaGuatemalaGuineaGuinea-BissauGuyanaHondurasHong Kong SAR, ChinaHungaryIndiaIndonesiaIran, Islamic Rep.IrelandItalyJamaicaJapanJordanKazakhstanKenyaKiribatiKorea, Rep.KosovoKyrgyz RepublicLao PDRLatviaLebanonLesothoLiberiaLiechtensteinLithuaniaLuxembourgMacao SAR, ChinaMacedonia, FYRMadagascarMalawiMalaysiaMaldivesMaliMarshall IslandsMauritaniaMauritiusMexicoMicronesia, Fed. Sts.MoldovaMongoliaMontenegroMoroccoMozambiqueNamibiaNepalNetherlandsNew ZealandNicaraguaNigerNigeriaNorwayOmanPakistanPalauPanamaPapua New GuineaParaguayPeruPolandPortugalRomaniaRussian FederationRwandaSao Tome and PrincipeSenegalSerbiaSeychellesSierra LeoneSingaporeSlovak RepublicSloveniaSolomon IslandsSomaliaSouth AfricaSpainSri LankaSt. Kitts and NevisSt. LuciaSt. Vincent and the GrenadinesSudanSurinameSwazilandSwedenSwitzerlandSyrian Arab RepublicTajikistanTanzaniaThailandTimor-LesteTongaTrinidad and TobagoTunisiaTurkeyTurkmenistanTuvaluUgandaUkraineUnited KingdomUnited StatesUruguayUzbekistanVanuatuVenezuela, RBVietnamWest Bank and GazaYemen, Rep.ZambiaZimbabwe línea de tiempo (timeline):
En esta escala de tiempo se presenta un gráfico de 1981 y 2016 de Equatorial Guinea. Los datos de 1980 están ausentes. El número de observaciones reales por fecha: 36.
Fuente (nombre):
Indicadores del desarrollo mundial
Fuente (organización):
World Bank national accounts data, and OECD National Accounts data files.
Categorías:
Economy & Growth
Se ha actualizado:
23 abr 2017 año
Los indicadores de los cambios de valor en los últimos años
Mínimo:
-33.482 bn
1 ene 2013 año
Máximo:
97.723 bn
1 ene 2016 año
A la fecha de observación
Valor
Cambio absoluto
El cambio con respecto al valor anterior
1 ene 1981 año
100.0 millones
+100.0 millones
0.0%
1 ene 1982 año
100.0 millones
0.0
0.0%
1 ene 1983 año
100.0 millones
0.0
0.0%
1 ene 1984 año
300.0 millones
+200.0 millones
200.0%
1 ene 1985 año
900.0 millones
+600.0 millones
200.0%
1 ene 1986 año
2.335 bn
+1.435 bn
159.42%
1 ene 1987 año
1.634 bn
-701.145 millones
-30.03%
1 ene 1988 año
1.983 bn
+349.4 millones
21.39%
1 ene 1989 año
2.304 bn
+321.0 millones
16.19%
1 ene 1990 año
2.348 bn
+44.0 millones
1.91%
1 ene 1991 año
2.237 bn
-111.0 millones
-4.73%
1 ene 1992 año
2.104 bn
-133.0 millones
-5.95%
1 ene 1993 año
2.29 bn
+186.0 millones
8.84%
1 ene 1994 año
2.466 bn
+176.0 millones
7.69%
1 ene 1995 año
2.661 bn
+195.0 millones
7.91%
1 ene 1996 año
3.223 bn
+562.0 millones
21.12%
1 ene 1997 año
2.956 bn
-267.0 millones
-8.28%
1 ene 1998 año
5.528 bn
+2.572 bn
87.01%
1 ene 1999 año
6.501 bn
+973.0 millones
17.6%
1 ene 2000 año
7.165 bn
+664.0 millones
10.21%
1 ene 2001 año
7.823 bn
+658.0 millones
9.18%
1 ene 2002 año
12.331 bn
+4.508 bn
57.62%
1 ene 2003 año
14.237 bn
+1.906 bn
15.46%
1 ene 2004 año
19.727 bn
+5.49 bn
38.56%
1 ene 2005 año
22.601 bn
+2.874 bn
14.57%
1 ene 2006 año
33.441 bn
+10.84 bn
47.96%
1 ene 2007 año
18.523 bn
-14.918 bn
-44.61%
1 ene 2008 año
26.113 bn
+7.59 bn
40.98%
1 ene 2009 año
-6.948 bn
-33.061 bn
-126.61%
1 ene 2010 año
53.902 bn
+60.85 bn
-875.79%
1 ene 2011 año
27.614 bn
-26.288 bn
-48.77%
1 ene 2012 año
-25.405 bn
-53.019 bn
-192.0%
1 ene 2013 año
-33.482 bn
-8.077 bn
31.79%
1 ene 2014 año
12.535 bn
+46.017 bn
-137.44%
1 ene 2015 año
70.629 bn
+58.094 bn
463.45%
1 ene 2016 año
97.723 bn
+27.094 bn
38.36%
Ranking de los países por los datos estadísticos actuales


Comentarios: