29
/es/
es
AIzaSyAYiBZKx7MnpbEhh9jyipgxe19OcubqV5w
April 1, 2024
207165
Nepal
NPL
true
2
1
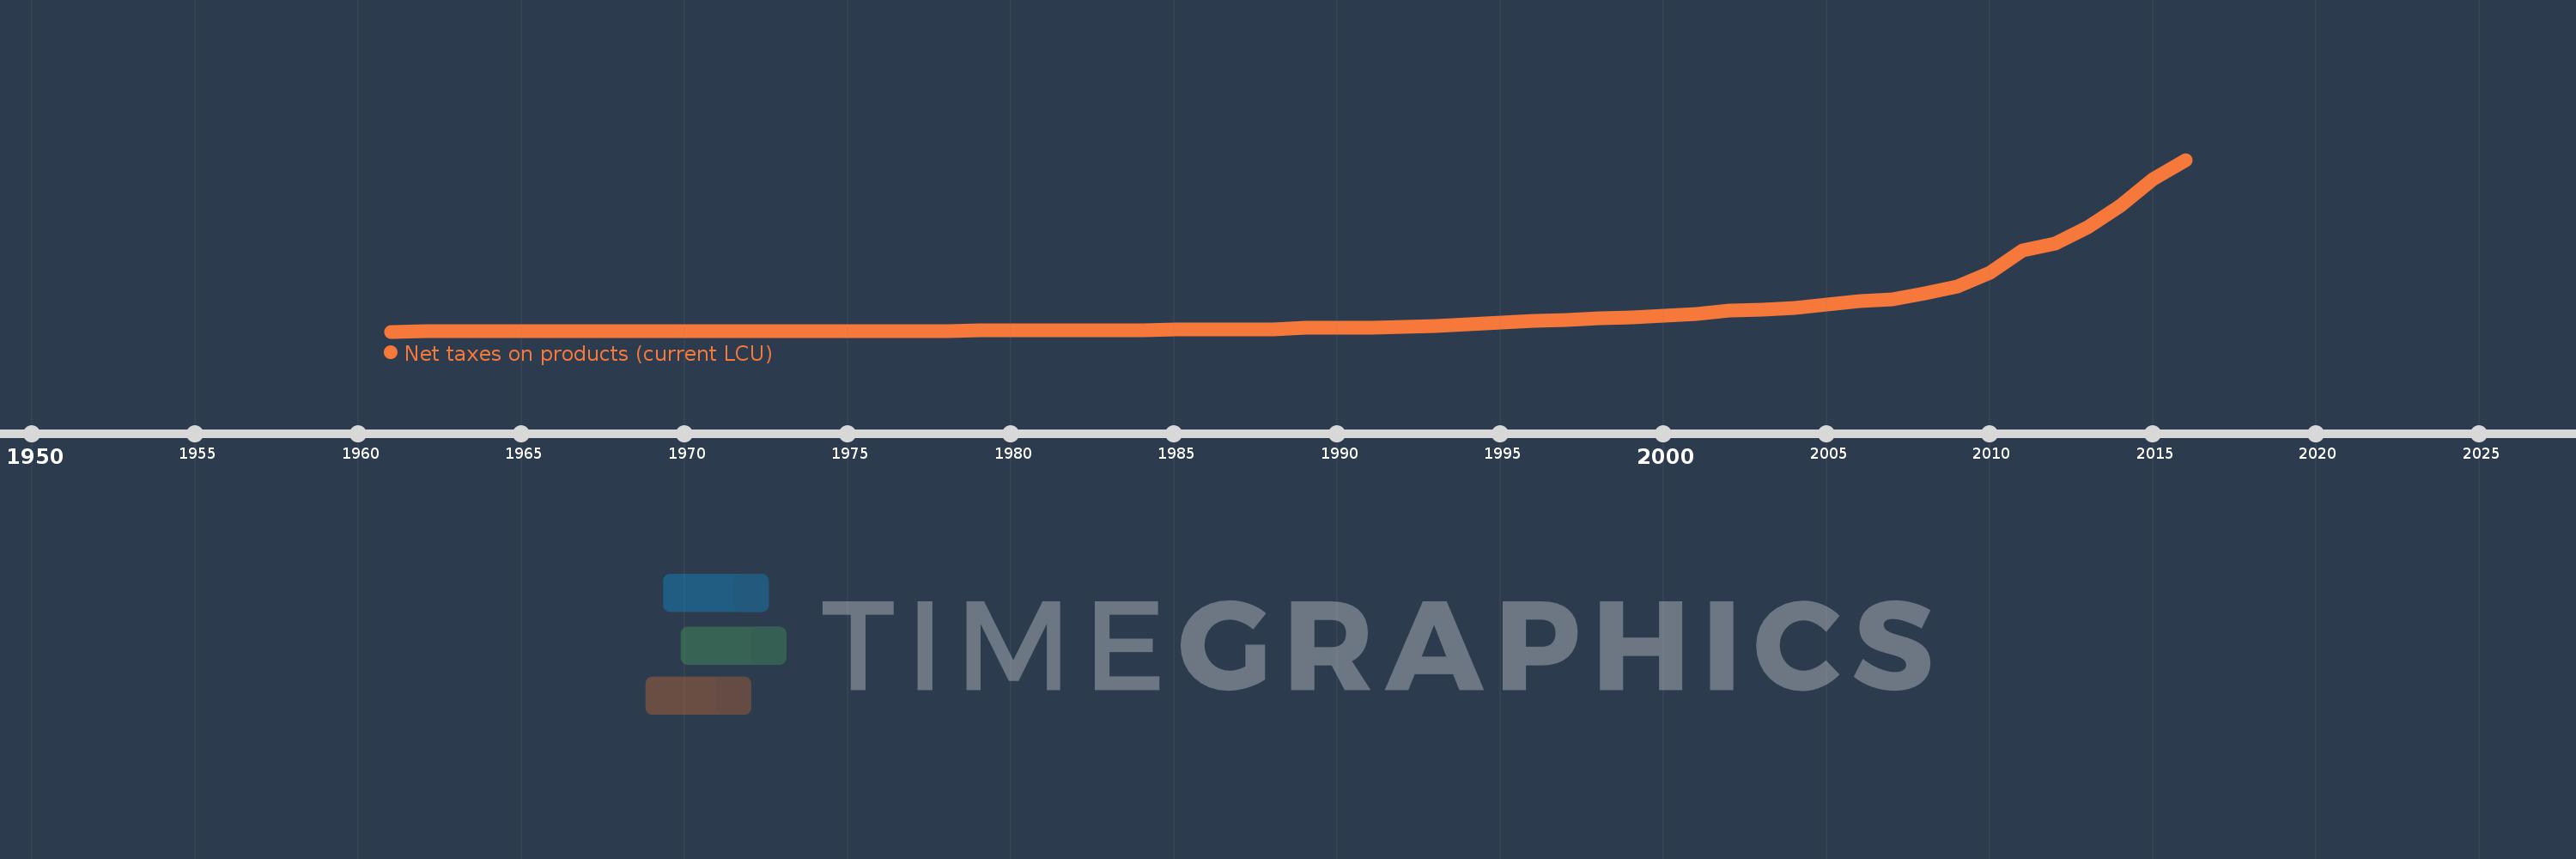
Net taxes on products (current LCU)
2016,2015,2014,2013,2012,2011,2010,2009,2008,2007,2006,2005,2004,2003,2002,2001,2000,1999,1998,1997,1996,1995,1994,1993,1992,1991,1990,1989,1988,1987,1986,1985,1984,1983,1982,1981,1980,1979,1978,1977,1976,1975,1974,1973,1972,1971,1970,1969,1968,1967,1966,1965,1964,1963,1962,1961
Estas estadísticas en otros países:
AfghanistanAlbaniaAlgeriaAndorraAntigua and BarbudaArgentinaArmeniaArubaAustraliaAustriaAzerbaijanBahamas, TheBahrainBangladeshBarbadosBelarusBelgiumBelizeBeninBermudaBhutanBoliviaBosnia and HerzegovinaBotswanaBrazilBulgariaBurkina FasoBurundiCabo VerdeCambodiaCameroonCanadaCentral African RepublicChadChileColombiaCongo, Dem. Rep.Costa RicaCroatiaCubaCyprusCzech RepublicDenmarkDjiboutiDominicaDominican RepublicEcuadorEgypt, Arab Rep.El SalvadorEquatorial GuineaEritreaEstoniaEthiopiaFaroe IslandsFijiFinlandFranceGabonGambia, TheGeorgiaGermanyGhanaGreeceGrenadaGuatemalaGuineaGuinea-BissauGuyanaHondurasHong Kong SAR, ChinaHungaryIndiaIndonesiaIran, Islamic Rep.IrelandItalyJamaicaJapanJordanKazakhstanKenyaKiribatiKorea, Rep.KosovoKyrgyz RepublicLao PDRLatviaLebanonLesothoLiberiaLiechtensteinLithuaniaLuxembourgMacao SAR, ChinaMacedonia, FYRMadagascarMalawiMalaysiaMaldivesMaliMarshall IslandsMauritaniaMauritiusMexicoMicronesia, Fed. Sts.MoldovaMongoliaMontenegroMoroccoMozambiqueNamibiaNepalNetherlandsNew ZealandNicaraguaNigerNigeriaNorwayOmanPakistanPalauPanamaPapua New GuineaParaguayPeruPolandPortugalRomaniaRussian FederationRwandaSao Tome and PrincipeSenegalSerbiaSeychellesSierra LeoneSingaporeSlovak RepublicSloveniaSolomon IslandsSomaliaSouth AfricaSpainSri LankaSt. Kitts and NevisSt. LuciaSt. Vincent and the GrenadinesSudanSurinameSwazilandSwedenSwitzerlandSyrian Arab RepublicTajikistanTanzaniaThailandTimor-LesteTongaTrinidad and TobagoTunisiaTurkeyTurkmenistanTuvaluUgandaUkraineUnited KingdomUnited StatesUruguayUzbekistanVanuatuVenezuela, RBVietnamWest Bank and GazaYemen, Rep.ZambiaZimbabwe línea de tiempo (timeline):
En esta escala de tiempo se presenta un gráfico de 1961 y 2016 de Nepal. Los datos de 1960 están ausentes. El número de observaciones reales por fecha: 56.
Fuente (nombre):
Indicadores del desarrollo mundial
Fuente (organización):
World Bank national accounts data, and OECD National Accounts data files.
Categorías:
Economy & Growth
Se ha actualizado:
23 abr 2017 año
Los indicadores de los cambios de valor en los últimos años
Mínimo:
54.0 millones
1 ene 1961 año
Máximo:
231.06 bn
1 ene 2016 año
A la fecha de observación
Valor
Cambio absoluto
El cambio con respecto al valor anterior
1 ene 1961 año
54.0 millones
+54.0 millones
0.0%
1 ene 1962 año
56.0 millones
+2.0 millones
3.7%
1 ene 1963 año
61.0 millones
+5.0 millones
8.93%
1 ene 1964 año
64.0 millones
+3.0 millones
4.92%
1 ene 1965 año
70.0 millones
+6.0 millones
9.38%
1 ene 1966 año
78.0 millones
+8.0 millones
11.43%
1 ene 1967 año
178.0 millones
+100.0 millones
128.21%
1 ene 1968 año
91.0 millones
-87.0 millones
-48.88%
1 ene 1969 año
108.0 millones
+17.0 millones
18.68%
1 ene 1970 año
161.0 millones
+53.0 millones
49.07%
1 ene 1971 año
55.0 millones
-106.0 millones
-65.84%
1 ene 1972 año
163.0 millones
+108.0 millones
196.36%
1 ene 1973 año
239.0 millones
+76.0 millones
46.63%
1 ene 1974 año
204.0 millones
-35.0 millones
-14.64%
1 ene 1975 año
383.0 millones
+179.0 millones
87.75%
1 ene 1976 año
635.0 millones
+252.0 millones
65.8%
1 ene 1977 año
805.0 millones
+170.0 millones
26.77%
1 ene 1978 año
1.025 bn
+220.0 millones
27.33%
1 ene 1979 año
1.306 bn
+281.0 millones
27.41%
1 ene 1980 año
1.436 bn
+130.0 millones
9.95%
1 ene 1981 año
1.465 bn
+29.0 millones
2.02%
1 ene 1982 año
1.841 bn
+376.0 millones
25.67%
1 ene 1983 año
1.951 bn
+110.0 millones
5.98%
1 ene 1984 año
2.117 bn
+166.0 millones
8.51%
1 ene 1985 año
2.386 bn
+269.0 millones
12.71%
1 ene 1986 año
2.571 bn
+185.0 millones
7.75%
1 ene 1987 año
3.007 bn
+436.0 millones
16.96%
1 ene 1988 año
3.492 bn
+485.0 millones
16.13%
1 ene 1989 año
4.692 bn
+1.2 bn
34.36%
1 ene 1990 año
4.758 bn
+66.0 millones
1.41%
1 ene 1991 año
5.668 bn
+910.0 millones
19.13%
1 ene 1992 año
6.532 bn
+864.0 millones
15.24%
1 ene 1993 año
7.487 bn
+955.0 millones
14.62%
1 ene 1994 año
9.702 bn
+2.215 bn
29.58%
1 ene 1995 año
12.149 bn
+2.447 bn
25.22%
1 ene 1996 año
14.261 bn
+2.112 bn
17.38%
1 ene 1997 año
15.457 bn
+1.196 bn
8.39%
1 ene 1998 año
17.952 bn
+2.495 bn
16.14%
1 ene 1999 año
18.943 bn
+991.0 millones
5.52%
1 ene 2000 año
21.456 bn
+2.513 bn
13.27%
1 ene 2001 año
23.945 bn
+2.489 bn
11.6%
1 ene 2002 año
28.091 bn
+4.146 bn
17.31%
1 ene 2003 año
29.046 bn
+955.0 millones
3.4%
1 ene 2004 año
31.906 bn
+2.86 bn
9.85%
1 ene 2005 año
36.05 bn
+4.144 bn
12.99%
1 ene 2006 año
40.927 bn
+4.877 bn
13.53%
1 ene 2007 año
42.966 bn
+2.039 bn
4.98%
1 ene 2008 año
51.968 bn
+9.002 bn
20.95%
1 ene 2009 año
60.401 bn
+8.433 bn
16.23%
1 ene 2010 año
78.744 bn
+18.343 bn
30.37%
1 ene 2011 año
109.358 bn
+30.614 bn
38.88%
1 ene 2012 año
118.472 bn
+9.114 bn
8.33%
1 ene 2013 año
139.862 bn
+21.39 bn
18.05%
1 ene 2014 año
169.79 bn
+29.928 bn
21.4%
1 ene 2015 año
205.602 bn
+35.812 bn
21.09%
1 ene 2016 año
231.06 bn
+25.458 bn
12.38%
Ranking de los países por los datos estadísticos actuales


Comentarios: