29
/es/
es
AIzaSyAYiBZKx7MnpbEhh9jyipgxe19OcubqV5w
April 1, 2024
257635
Switzerland
CHE
true
2
1
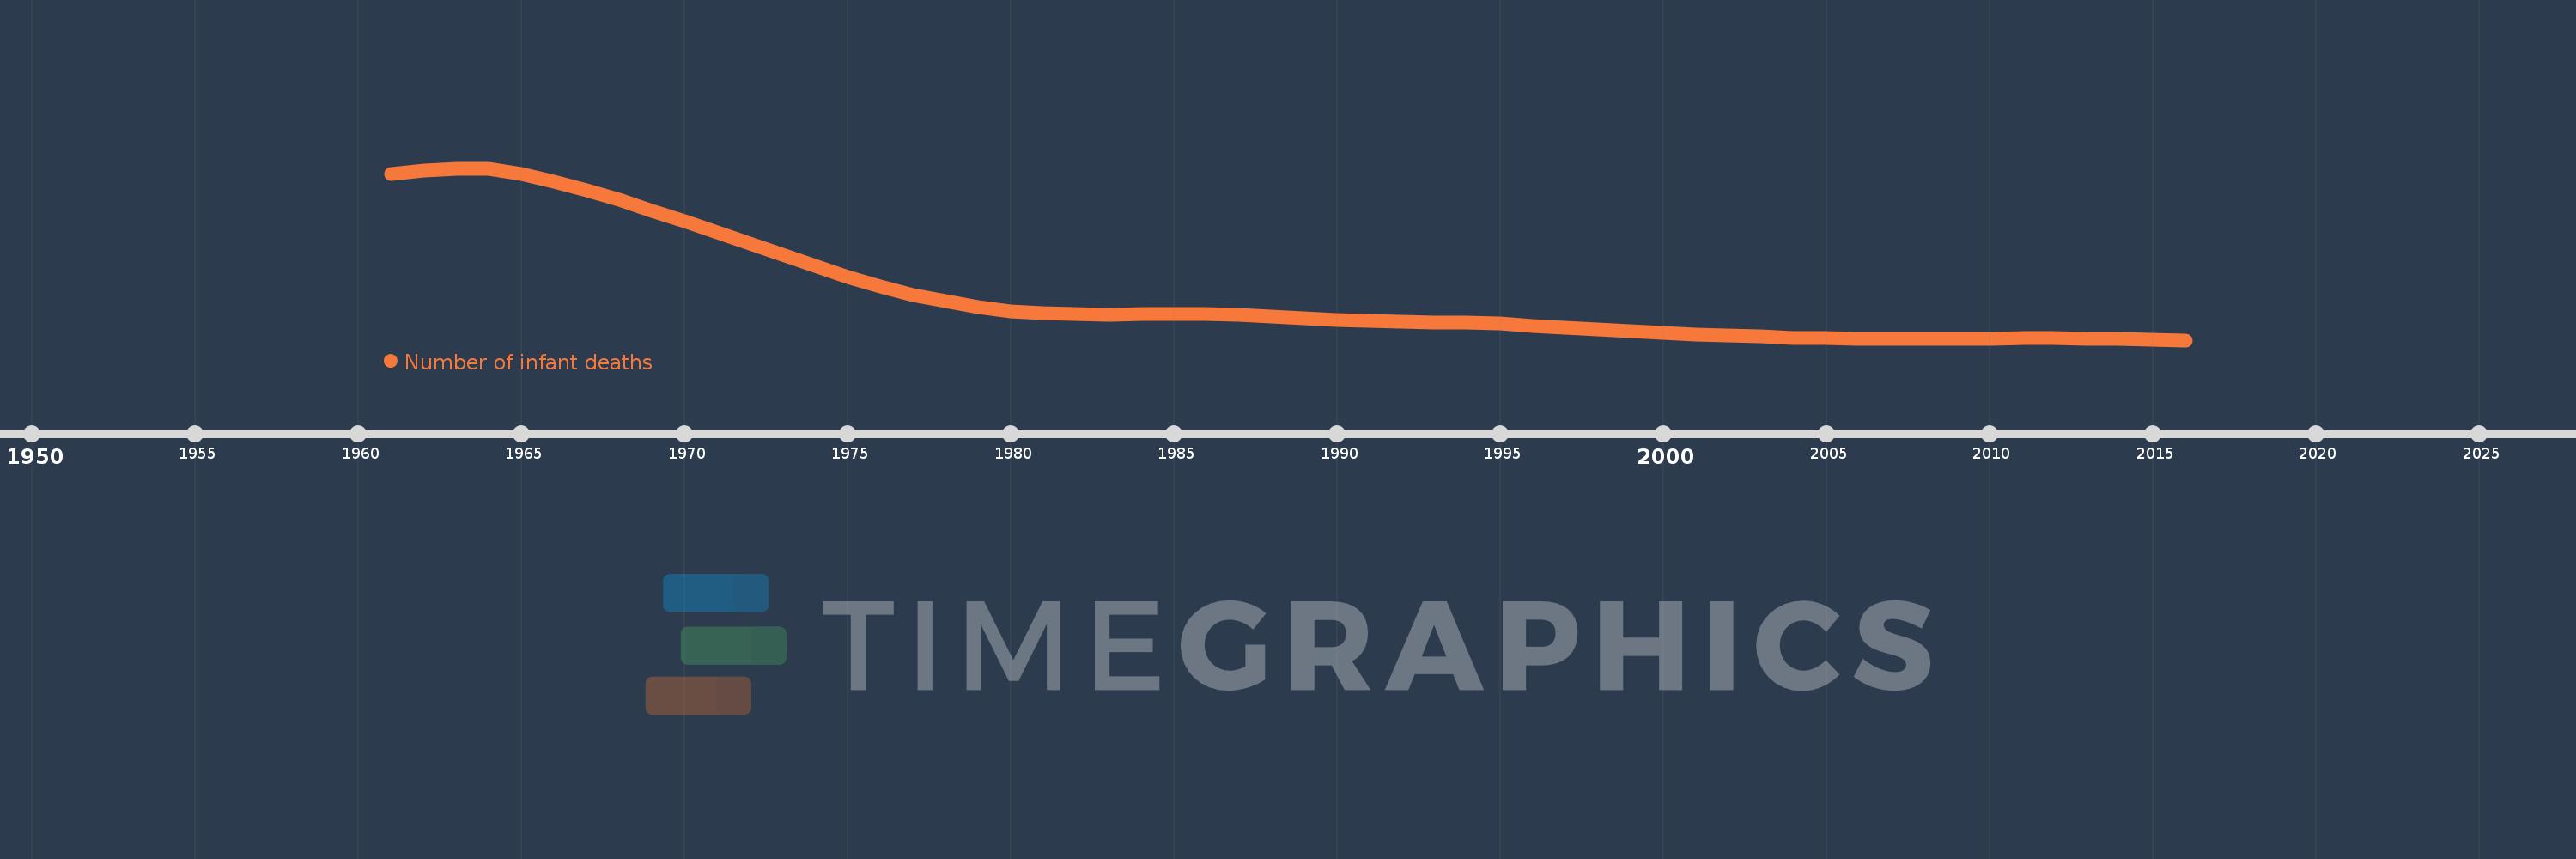
Number of infant deaths
2016,2015,2014,2013,2012,2011,2010,2009,2008,2007,2006,2005,2004,2003,2002,2001,2000,1999,1998,1997,1996,1995,1994,1993,1992,1991,1990,1989,1988,1987,1986,1985,1984,1983,1982,1981,1980,1979,1978,1977,1976,1975,1974,1973,1972,1971,1970,1969,1968,1967,1966,1965,1964,1963,1962,1961
Estas estadísticas en otros países:
AfghanistanAlbaniaAlgeriaAndorraAngolaAntigua and BarbudaArgentinaArmeniaAustraliaAustriaAzerbaijanBahamas, TheBahrainBangladeshBarbadosBelarusBelgiumBelizeBeninBhutanBoliviaBosnia and HerzegovinaBotswanaBrazilBrunei DarussalamBulgariaBurkina FasoBurundiCabo VerdeCambodiaCameroonCanadaCentral African RepublicChadChileChinaColombiaComorosCongo, Dem. Rep.Congo, Rep.Costa RicaCote d'IvoireCroatiaCubaCyprusCzech RepublicDenmarkDjiboutiDominicaDominican RepublicEast Asia & Pacific (excluding high income)EcuadorEgypt, Arab Rep.El SalvadorEquatorial GuineaEritreaEstoniaEthiopiaEurope & Central Asia (excluding high income)FijiFinlandFranceGabonGambia, TheGeorgiaGermanyGhanaGreeceGrenadaGuatemalaGuineaGuinea-BissauGuyanaHaitiHigh incomeHondurasHungaryIcelandIndiaIndonesiaIran, Islamic Rep.IraqIrelandIsraelItalyJamaicaJapanJordanKazakhstanKenyaKiribatiKorea, Dem. People’s Rep.Korea, Rep.KuwaitKyrgyz RepublicLao PDRLatin America & Caribbean (excluding high income)LatviaLebanonLesothoLiberiaLibyaLithuaniaLow & middle incomeLow incomeLower middle incomeLuxembourgMacedonia, FYRMadagascarMalawiMalaysiaMaldivesMaliMaltaMarshall IslandsMauritaniaMauritiusMexicoMicronesia, Fed. Sts.Middle East & North Africa (excluding high income)Middle incomeMoldovaMonacoMongoliaMontenegroMoroccoMozambiqueMyanmarNamibiaNauruNepalNetherlandsNew ZealandNicaraguaNigerNigeriaNorwayOmanPakistanPalauPanamaPapua New GuineaParaguayPeruPhilippinesPolandPortugalQatarRomaniaRussian FederationRwandaSamoaSan MarinoSao Tome and PrincipeSaudi ArabiaSenegalSerbiaSeychellesSierra LeoneSingaporeSlovak RepublicSloveniaSolomon IslandsSomaliaSouth AfricaSouth AsiaSouth SudanSpainSri LankaSt. Kitts and NevisSt. LuciaSt. Vincent and the GrenadinesSub-Saharan Africa (excluding high income)SudanSurinameSwazilandSwedenSwitzerlandSyrian Arab RepublicTajikistanTanzaniaThailandTimor-LesteTogoTongaTrinidad and TobagoTunisiaTurkeyTurkmenistanTuvaluUgandaUkraineUnited Arab EmiratesUnited KingdomUnited StatesUpper middle incomeUruguayUzbekistanVanuatuVenezuela, RBVietnamWest Bank and GazaWorldYemen, Rep.ZambiaZimbabwe línea de tiempo (timeline):
En esta escala de tiempo se presenta un gráfico de 1961 y 2016 de Switzerland. Los datos de 1960 están ausentes. El número de observaciones reales por fecha: 56.
Fuente (nombre):
Indicadores del desarrollo mundial
Fuente (organización):
Estimates developed by the UN Inter-agency Group for Child Mortality Estimation (UNICEF, WHO, World Bank, UN DESA Population Division) at www.childmortality.org.
Categorías:
Health
Se ha actualizado:
23 abr 2017 año
Los indicadores de los cambios de valor en los últimos años
Mínimo:
291.0
1 ene 2016 año
Máximo:
2.179 mil
1 ene 1963 año
A la fecha de observación
Valor
Cambio absoluto
El cambio con respecto al valor anterior
1 ene 1961 año
2.116 mil
+2.116 mil
0.0%
1 ene 1962 año
2.157 mil
+41.0
1.94%
1 ene 1963 año
2.179 mil
+22.0
1.02%
1 ene 1964 año
2.173 mil
-6.0
-0.28%
1 ene 1965 año
2.121 mil
-52.0
-2.39%
1 ene 1966 año
2.031 mil
-90.0
-4.24%
1 ene 1967 año
1.936 mil
-95.0
-4.68%
1 ene 1968 año
1.832 mil
-104.0
-5.37%
1 ene 1969 año
1.712 mil
-120.0
-6.55%
1 ene 1970 año
1.596 mil
-116.0
-6.78%
1 ene 1971 año
1.478 mil
-118.0
-7.39%
1 ene 1972 año
1.355 mil
-123.0
-8.32%
1 ene 1973 año
1.233 mil
-122.0
-9.0%
1 ene 1974 año
1.107 mil
-126.0
-10.22%
1 ene 1975 año
989.0
-118.0
-10.66%
1 ene 1976 año
881.0
-108.0
-10.92%
1 ene 1977 año
787.0
-94.0
-10.67%
1 ene 1978 año
717.0
-70.0
-8.89%
1 ene 1979 año
655.0
-62.0
-8.65%
1 ene 1980 año
611.0
-44.0
-6.72%
1 ene 1981 año
591.0
-20.0
-3.27%
1 ene 1982 año
577.0
-14.0
-2.37%
1 ene 1983 año
571.0
-6.0
-1.04%
1 ene 1984 año
575.0
+4.0
0.7%
1 ene 1985 año
576.0
+1.0
0.17%
1 ene 1986 año
577.0
+1.0
0.17%
1 ene 1987 año
568.0
-9.0
-1.56%
1 ene 1988 año
551.0
-17.0
-2.99%
1 ene 1989 año
532.0
-19.0
-3.45%
1 ene 1990 año
511.0
-21.0
-3.95%
1 ene 1991 año
505.0
-6.0
-1.17%
1 ene 1992 año
493.0
-12.0
-2.38%
1 ene 1993 año
488.0
-5.0
-1.01%
1 ene 1994 año
483.0
-5.0
-1.02%
1 ene 1995 año
472.0
-11.0
-2.28%
1 ene 1996 año
451.0
-21.0
-4.45%
1 ene 1997 año
431.0
-20.0
-4.43%
1 ene 1998 año
412.0
-19.0
-4.41%
1 ene 1999 año
390.0
-22.0
-5.34%
1 ene 2000 año
367.0
-23.0
-5.9%
1 ene 2001 año
348.0
-19.0
-5.18%
1 ene 2002 año
346.0
-2.0
-0.57%
1 ene 2003 año
331.0
-15.0
-4.34%
1 ene 2004 año
313.0
-18.0
-5.44%
1 ene 2005 año
312.0
-1.0
-0.32%
1 ene 2006 año
307.0
-5.0
-1.6%
1 ene 2007 año
305.0
-2.0
-0.65%
1 ene 2008 año
305.0
0.0
0.0%
1 ene 2009 año
307.0
+2.0
0.66%
1 ene 2010 año
308.0
+1.0
0.33%
1 ene 2011 año
315.0
+7.0
2.27%
1 ene 2012 año
312.0
-3.0
-0.95%
1 ene 2013 año
307.0
-5.0
-1.6%
1 ene 2014 año
302.0
-5.0
-1.63%
1 ene 2015 año
296.0
-6.0
-1.99%
1 ene 2016 año
291.0
-5.0
-1.69%
Ranking de los países por los datos estadísticos actuales


Comentarios: