29
/es/
es
AIzaSyAYiBZKx7MnpbEhh9jyipgxe19OcubqV5w
April 1, 2024
256666
Sweden
SWE
true
2
1
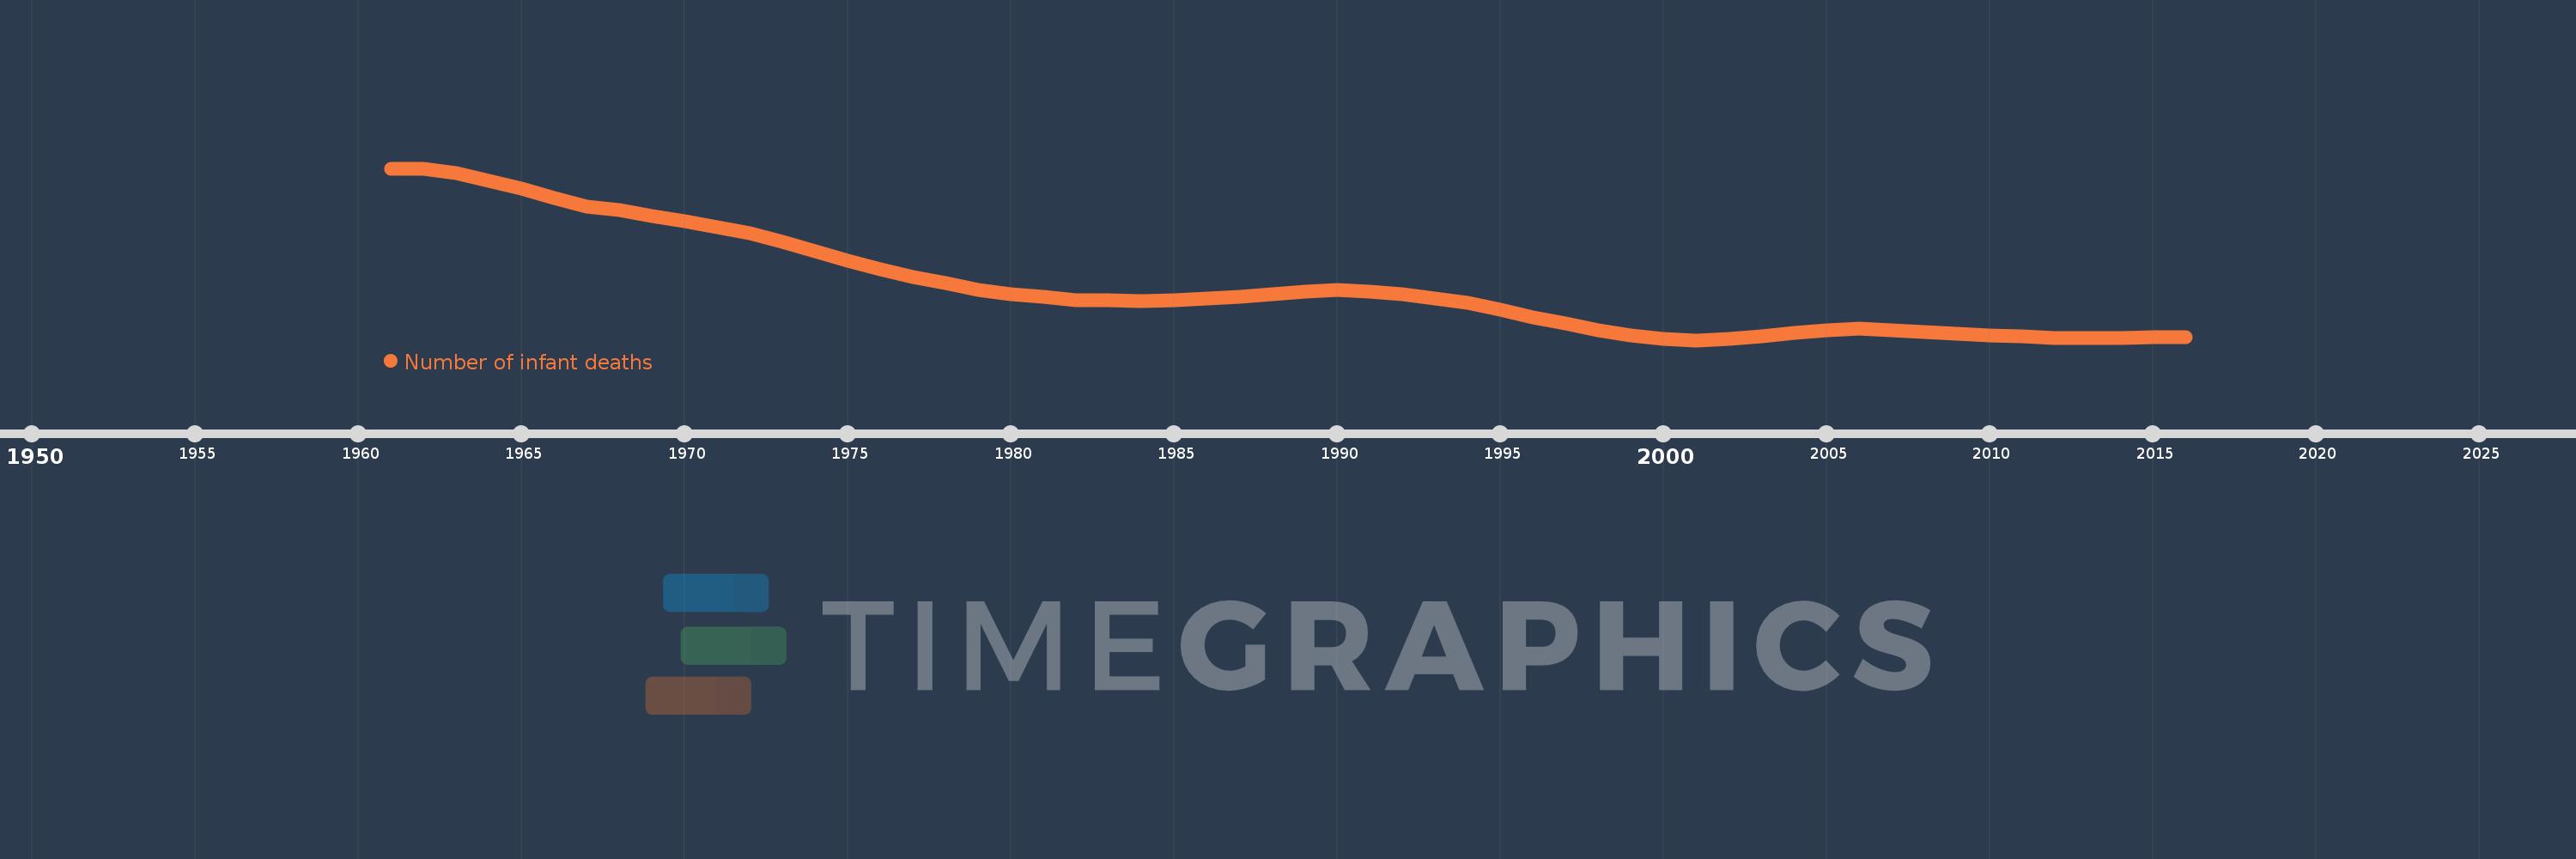
Number of infant deaths
2016,2015,2014,2013,2012,2011,2010,2009,2008,2007,2006,2005,2004,2003,2002,2001,2000,1999,1998,1997,1996,1995,1994,1993,1992,1991,1990,1989,1988,1987,1986,1985,1984,1983,1982,1981,1980,1979,1978,1977,1976,1975,1974,1973,1972,1971,1970,1969,1968,1967,1966,1965,1964,1963,1962,1961
Estas estadísticas en otros países:
AfghanistanAlbaniaAlgeriaAndorraAngolaAntigua and BarbudaArgentinaArmeniaAustraliaAustriaAzerbaijanBahamas, TheBahrainBangladeshBarbadosBelarusBelgiumBelizeBeninBhutanBoliviaBosnia and HerzegovinaBotswanaBrazilBrunei DarussalamBulgariaBurkina FasoBurundiCabo VerdeCambodiaCameroonCanadaCentral African RepublicChadChileChinaColombiaComorosCongo, Dem. Rep.Congo, Rep.Costa RicaCote d'IvoireCroatiaCubaCyprusCzech RepublicDenmarkDjiboutiDominicaDominican RepublicEast Asia & Pacific (excluding high income)EcuadorEgypt, Arab Rep.El SalvadorEquatorial GuineaEritreaEstoniaEthiopiaEurope & Central Asia (excluding high income)FijiFinlandFranceGabonGambia, TheGeorgiaGermanyGhanaGreeceGrenadaGuatemalaGuineaGuinea-BissauGuyanaHaitiHigh incomeHondurasHungaryIcelandIndiaIndonesiaIran, Islamic Rep.IraqIrelandIsraelItalyJamaicaJapanJordanKazakhstanKenyaKiribatiKorea, Dem. People’s Rep.Korea, Rep.KuwaitKyrgyz RepublicLao PDRLatin America & Caribbean (excluding high income)LatviaLebanonLesothoLiberiaLibyaLithuaniaLow & middle incomeLow incomeLower middle incomeLuxembourgMacedonia, FYRMadagascarMalawiMalaysiaMaldivesMaliMaltaMarshall IslandsMauritaniaMauritiusMexicoMicronesia, Fed. Sts.Middle East & North Africa (excluding high income)Middle incomeMoldovaMonacoMongoliaMontenegroMoroccoMozambiqueMyanmarNamibiaNauruNepalNetherlandsNew ZealandNicaraguaNigerNigeriaNorwayOmanPakistanPalauPanamaPapua New GuineaParaguayPeruPhilippinesPolandPortugalQatarRomaniaRussian FederationRwandaSamoaSan MarinoSao Tome and PrincipeSaudi ArabiaSenegalSerbiaSeychellesSierra LeoneSingaporeSlovak RepublicSloveniaSolomon IslandsSomaliaSouth AfricaSouth AsiaSouth SudanSpainSri LankaSt. Kitts and NevisSt. LuciaSt. Vincent and the GrenadinesSub-Saharan Africa (excluding high income)SudanSurinameSwazilandSwedenSwitzerlandSyrian Arab RepublicTajikistanTanzaniaThailandTimor-LesteTogoTongaTrinidad and TobagoTunisiaTurkeyTurkmenistanTuvaluUgandaUkraineUnited Arab EmiratesUnited KingdomUnited StatesUpper middle incomeUruguayUzbekistanVanuatuVenezuela, RBVietnamWest Bank and GazaWorldYemen, Rep.ZambiaZimbabwe línea de tiempo (timeline):
En esta escala de tiempo se presenta un gráfico de 1961 y 2016 de Sweden. Los datos de 1960 están ausentes. El número de observaciones reales por fecha: 56.
Fuente (nombre):
Indicadores del desarrollo mundial
Fuente (organización):
Estimates developed by the UN Inter-agency Group for Child Mortality Estimation (UNICEF, WHO, World Bank, UN DESA Population Division) at www.childmortality.org.
Categorías:
Health
Se ha actualizado:
23 abr 2017 año
Los indicadores de los cambios de valor en los últimos años
Mínimo:
242.0
1 ene 2001 año
Máximo:
1.868 mil
1 ene 1961 año
A la fecha de observación
Valor
Cambio absoluto
El cambio con respecto al valor anterior
1 ene 1961 año
1.868 mil
+1.868 mil
0.0%
1 ene 1962 año
1.865 mil
-3.0
-0.16%
1 ene 1963 año
1.827 mil
-38.0
-2.04%
1 ene 1964 año
1.751 mil
-76.0
-4.16%
1 ene 1965 año
1.673 mil
-78.0
-4.45%
1 ene 1966 año
1.589 mil
-84.0
-5.02%
1 ene 1967 año
1.51 mil
-79.0
-4.97%
1 ene 1968 año
1.47 mil
-40.0
-2.65%
1 ene 1969 año
1.416 mil
-54.0
-3.67%
1 ene 1970 año
1.369 mil
-47.0
-3.32%
1 ene 1971 año
1.312 mil
-57.0
-4.16%
1 ene 1972 año
1.253 mil
-59.0
-4.5%
1 ene 1973 año
1.176 mil
-77.0
-6.15%
1 ene 1974 año
1.085 mil
-91.0
-7.74%
1 ene 1975 año
993.0
-92.0
-8.48%
1 ene 1976 año
913.0
-80.0
-8.06%
1 ene 1977 año
843.0
-70.0
-7.67%
1 ene 1978 año
784.0
-59.0
-7.0%
1 ene 1979 año
719.0
-65.0
-8.29%
1 ene 1980 año
681.0
-38.0
-5.29%
1 ene 1981 año
652.0
-29.0
-4.26%
1 ene 1982 año
623.0
-29.0
-4.45%
1 ene 1983 año
620.0
-3.0
-0.48%
1 ene 1984 año
613.0
-7.0
-1.13%
1 ene 1985 año
622.0
+9.0
1.47%
1 ene 1986 año
636.0
+14.0
2.25%
1 ene 1987 año
653.0
+17.0
2.67%
1 ene 1988 año
673.0
+20.0
3.06%
1 ene 1989 año
704.0
+31.0
4.61%
1 ene 1990 año
719.0
+15.0
2.13%
1 ene 1991 año
702.0
-17.0
-2.36%
1 ene 1992 año
677.0
-25.0
-3.56%
1 ene 1993 año
633.0
-44.0
-6.5%
1 ene 1994 año
594.0
-39.0
-6.16%
1 ene 1995 año
531.0
-63.0
-10.61%
1 ene 1996 año
460.0
-71.0
-13.37%
1 ene 1997 año
403.0
-57.0
-12.39%
1 ene 1998 año
339.0
-64.0
-15.88%
1 ene 1999 año
289.0
-50.0
-14.75%
1 ene 2000 año
251.0
-38.0
-13.15%
1 ene 2001 año
242.0
-9.0
-3.59%
1 ene 2002 año
255.0
+13.0
5.37%
1 ene 2003 año
280.0
+25.0
9.8%
1 ene 2004 año
311.0
+31.0
11.07%
1 ene 2005 año
338.0
+27.0
8.68%
1 ene 2006 año
351.0
+13.0
3.85%
1 ene 2007 año
336.0
-15.0
-4.27%
1 ene 2008 año
323.0
-13.0
-3.87%
1 ene 2009 año
304.0
-19.0
-5.88%
1 ene 2010 año
284.0
-20.0
-6.58%
1 ene 2011 año
278.0
-6.0
-2.11%
1 ene 2012 año
264.0
-14.0
-5.04%
1 ene 2013 año
264.0
0.0
0.0%
1 ene 2014 año
265.0
+1.0
0.38%
1 ene 2015 año
267.0
+2.0
0.75%
1 ene 2016 año
271.0
+4.0
1.5%
Ranking de los países por los datos estadísticos actuales


Comentarios: